

Despite sluggish EV sales in the U.S., it’s full steam ahead for electric vehicles in most other regions.
Electric vehicles may be struggling to find buyers in the U.S. — but they’re making inroads elsewhere.
A record-breaking 28% of new cars sold this year will be battery-powered, according to new data from the International Energy Agency. That’s a big deal: Driving around in gas-guzzling vehicles spews tons of planet-warming and health-harming pollution into the atmosphere.
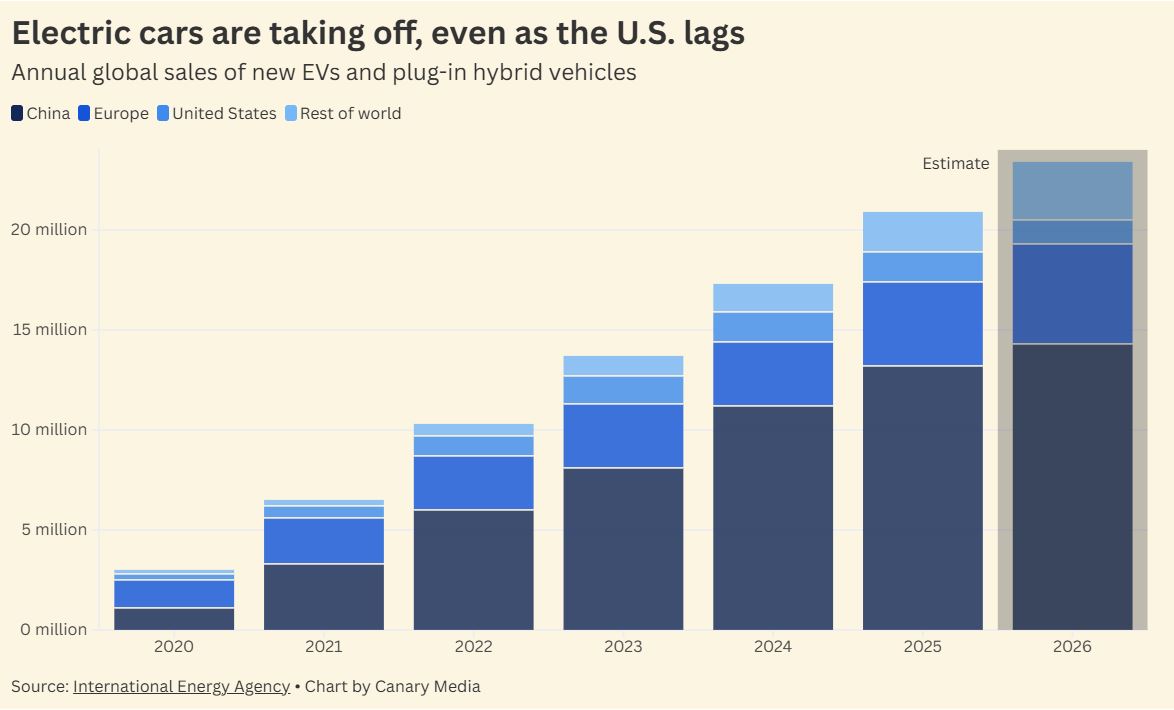
The latest projections come even as the Trump administration’s attacks on electric vehicles stymie sales in the U.S., the world’s second-largest car market. The country is a massive laggard when it comes to EV adoption, with electric models making up just around 10% of new car sales. New EV sales are expected to decline for the second year in a row in the U.S., though used models are surging in popularity.
But outside the U.S., the picture is very different. The clearest example of that contrast is China, the world’s biggest car market and the global leader in electric vehicle and battery manufacturing. Nearly 60% of cars sold in China this year will be electrified.
EV sales are growing rapidly across the rest of Asia, too. This year, sales are expected to leap by over 50% across Asian countries other than China, IEA found, driven in large part by the availability of super affordable Chinese EV models.
In Europe, which has strong emissions standards that push consumers toward EVs, sales are growing especially fast. This year, EVs will make up one-third of new cars sold in the region, powered not only by EV-adoption poster child Norway but also by rapid uptake in Germany, the U.K., and Turkey.
It’s worth emphasizing that these figures are for new car sales only. It will take longer for EVs to become the most popular type of car on the road: Right now, they make up just about 5% of the global car fleet.
Still, we’re well past the peak for gas car sales, and the trends are in favor of EVs. By 2035, the IEA expects half the new cars sold worldwide to be EVs. In China and the E.U., 90% of new cars could be EVs by that time.
And then there’s the war in Iran, which has caused the price of gasoline to surge and even resulted in fossil-fuel shortages in some countries. The crisis is adding more urgency to the transition to electric vehicles, particularly for nations that rely on imported oil. As EVs get cheaper and the volatility of fossil fuels becomes more apparent, economics may start to drive the transition from gas cars faster than climate goals ever could.
From the suburbs to the barrier islands, the state’s local cooperatives are using aggregated battery systems to weather outages and protect consumers’ wallets.
In July 2022, a fierce summer storm rocked Wake Electric, a North Carolina cooperative serving nearly 60,000 households and other customers from the dense suburbs of Raleigh, the state capital, to rural areas along the Virginia border and in the coastal plain. Wind downed lines and knocked out power for thousands for over seven hours.
“It was one of these very difficult outages where we had a line laying across a road,” said Don Bowman, the co-op’s senior vice president and assistant general manager. “We had to coordinate a lot of activities, and it took us a while to get this power back on.”
But Eagle Chase, a small housing community equipped with a propane-fueled generator and a 1-megawatt Tesla battery pack, was almost completely unscathed. The devices form a microgrid that can function without the co-op’s larger distribution system of poles and wires.
“The success story,” Bowman said, “is the Eagle Chase development saw an outage of less than about 58 milliseconds.”
The Eagle Chase battery is among three storage systems in Wake Electric’s territory. The second, in Wake Forest, is a 1-megawatt-hour battery paired with a 500-kilowatt solar farm; its purpose is to dispatch solar electrons when the sun doesn’t shine. The third, a 5-megawatt battery located at the co-op’s main substation, stores power that can be discharged when supplies are constrained and electricity prices are high.
The systems illustrate three key advantages of battery storage, Bowman said: providing resiliency, increasing the reliability of renewable energy, and responding to periods of high demand.
“We have three systems, and I think that we check all three of those boxes differently with each of the projects,” he said.

Wake Electric isn’t alone. As of April 2025, rural co-ops across North Carolina had 43 battery projects operating or in development, according to the National Rural Electric Cooperative Association. Co-ops here were spearheading more grid batteries than those in any other state; Alaska was a distant second with 13 projects.
The co-ops say they aren’t trying to win any national contests. They’re just trying to do right by the members they serve.
“Community support is one of the pillars we drive toward,” said Erik Hall, a director at the North Carolina Electric Membership Corp., a statewide entity that owns the battery assets and provides generation and transmission for 25 rural cooperatives. “What can we do to support the membership?”
The battery investments are partly a response to challenges now sweeping the country: Skyrocketing demand from data centers and other factors are constraining supplies and triggering expensive grid upgrades, driving up the costs of electricity.
Storing electrons for use when demand is at its peak and prices are high is a huge money saver for these customer-owned nonprofits — especially as the costs of batteries are falling and federal tax credits for the resources are still available.
“What these battery systems have been able to do is really save folks money while increasing resilience, and helping with reliability sort of across the footprint,” said Rob Greskowiak, chief commercial officer for Lightshift Energy, a storage developer that has worked with several co-ops outside North Carolina, including in neighboring Virginia. “It’s really an economic story.”
Money isn’t the only motivator. Co-ops often serve far-flung corners of the state, where an investor-owned utility like Duke Energy would earn a meager profit. Many of these areas — from rugged mountains to fragile barrier islands — are also prone to outages from extreme weather.
That’s why almost a decade ago, Tideland Electric Member Corp. set up the state’s first cooperative-run microgrid on Ocracoke Island — complete with 62 solar panels, a battery pack, and a diesel generator. The system kept the power on for island residents in the summer of 2017, after a construction crew accidentally severed a transmission line to the mainland.
“The solar worked,” Heidi Smith, a Tideland co-op manager, said back then. “The Tesla batteries were able to add power to the system.”
North Carolina’s co-ops also have set a target of zeroing out their carbon emissions by midcentury, though, unlike Duke, they’re not required to by law.
“It’s in our mission statement to constantly be moving toward cleaner energy solutions,” Bowman of Wake Electric co-op explained.
The benefits and costs of the individual battery systems can be spread out among the co-ops and their millions of customers, since all these storage devices are managed by the North Carolina Electric Membership Corp.
“Having all of these assets is wonderful,” the corporation’s Hall said. “But if you can’t aggregate them and utilize them when they’re needed, then you’re not really bringing to bear the value of them.”
That means calling on the storage assets when high demand sends electricity prices soaring or dispatching them during extreme weather events to enhance reliability.
“I sound like I’m tooting our horn, and I am,” Hall said. “We’ve built one of the most innovative and capable [distributed energy resource management] systems in the country.”
“I don’t call it a virtual power plant, because it sounds very financial, economic,” he added. “Our systems are grounded in reliability.”
Still, not every move made by the state’s co-ops has been in lockstep with the clean energy transition. North Carolina Electric Membership Corp. is pursuing a large new gas-generation plant in Person County in conjunction with Duke and already owns two single-cycle, peaking gas plants outright. It’s also made a long-shot bid to the Federal Energy Regulatory Commission that, if successful, could upend how transmission upgrades are paid for and stall new solar from coming onto the grid.
The split screen just reinforces that batteries are not, for many adopters, first and foremost about curbing carbon emissions.
“North Carolina can be viewed as a leader in this space, but I think it’s important to reiterate that it’s not because of sustainability goals or clean energy goals,” Greskowiak said. “The economic case for battery storage is only going to grow. The rest of the country is catching up.”
The Trump admin’s new rules block Americans from accessing rebates for electric heat pumps if they previously had oil, natural gas, or propane systems.
This article originally appeared on Inside Climate News, a nonprofit, nonpartisan news organization that covers climate, energy, and the environment. Sign up for their newsletter.
Federal energy efficiency rebate programs will no longer cover a switch from fossil fuels to electricity for heating, according to long-awaited guidance from the Department of Energy.
The department published an update on how it will implement consumer programs with $8.8 billion in funding. The new provisions include eliminating use of diversity, equity, and inclusion considerations, among other changes.
This follows legal challenges after President Donald Trump issued an executive order last year, upon returning to office, canceling the release of funds from President Joe Biden’s Inflation Reduction Act, including rebates for home energy efficiency. A coalition of states successfully sued to restore the funding, obtaining an injunction in March 2025.
States have been waiting for the Department of Energy to reopen funding, a process that begins with this latest publication.
Clean energy and environmental advocates said the guidance was overdue and severely flawed.
Tony Sirna, deputy policy director for Evergreen Action, said it’s “flatly illegal” to eliminate funding for electrification through an agency’s guidance rather than passing a new law. “This is a deliberate effort to deny relief to millions of families at the exact moment they need it the most,” he said in a statement.
The guidance, dated May 29 and announced in a news release on June 1, covers the $4.3 billion Home Owner Managing Energy Savings, or HOMES, program and the $4.5 billion High-Efficiency Electric Home Rebate, or HEEHR, program, with additional guidance for Indian tribes participating in HEEHR.
The HOMES program provides up to $8,000 for households to make energy-efficient upgrades, including insulation, air sealing, heating and cooling equipment, water heaters, duct sealing, appliances, and lighting, according to the Department of Energy. The upgrades must reduce energy use by at least 20 percent to be eligible.
The HEEHR program provides up to $14,000 in rebates per household, which retailers and contractors can offer at the point of sale, and can be used for qualifying efficient electric equipment and appliances.
Congress and the Biden administration designed the programs to ensure that low-income and other disadvantaged households received a significant share of the benefits. The new guidance is changing this focus, citing the Trump administration’s opposition to considering diversity, equity, and inclusion in federal spending and the elimination of Biden’s Justice40 environmental justice initiative.
The guidance also eliminates the programs’ support for shifting from oil, gas, or other fossil fuels to electricity for home heating. Now, households can only get funding for heat pumps for new construction or if they already have electric heat, as opposed to the previous rules that encouraged people to switch away from fossil fuels.
Another change is that the Department of Energy now requires households to upgrade their insulation and air sealing before using rebates for new appliances.
Reaction was mostly negative from groups that push for improvements in energy efficiency.
“It’s a very standard playbook to incentivize fossil fuel companies and provide a lifeline to them,” said Srinidhi Sampath Kumar, director of the Sierra Club’s clean heat campaign, about the limits on fuel switching. “It’s absolutely been done in bad faith.”
Mark Kresowik, senior policy director for the American Council for an Energy-Efficient Economy, said in a statement that the programs “will help families make energy-saving improvements that lower their utility bills,” but he lamented the new limits on the programs.
The guidance is “a fundamental departure” from the intent of the programs, said Sam Friesen, managing director for buildings at Fresh Energy, a Minnesota-based environmental advocacy group. He added that the changes will muddy the waters for consumers who were making plans under the old rules and now need to follow the new ones.
Robin Yochum, buildings program director for the Southwest Energy Efficiency Project, a regional nonprofit based in Colorado, said she is pleased to see this step to implement the programs but is concerned about limits on fuel shifting.
“While there are certainly many electrically heated homes that deserve efficiency upgrades, helping households transition from propane, fuel oil, and natural gas to highly efficient electric technologies was one of the most transformative aspects of the original program design,” she said in an email.
Asked for a response, a Department of Energy spokesperson had this comment: “The Department of Energy has released common-sense revisions to program guidance to align requirements more closely with statutory requirements, advance affordability, ensure good stewardship of taxpayer dollars, and empower grantees to tailor their programs to local contexts and residents’ needs.”
State programs administer the money but the federal government must approve the state plans before the funds are released. Most states plus the District of Columbia have had at least some of their plans approved, as shown in a May 18 update from Atlas Public Policy.
Some already paid rebates based on the initial rules under the Biden administration. Those states now have three months to modify their programs to comply with the new guidance going forward.
South Dakota has declined to participate, and Idaho’s legislature has taken action to stop participating.
Consumers can contact their state energy offices to get more information about program availability.
The package of geothermal permitting reforms comes as Republicans and Democrats alike look to boost clean, 24/7 power supplies. Now it heads to the Senate.
The U.S. House just approved a bipartisan package of bills to accelerate geothermal energy as the nation clamors for more around-the-clock clean electricity.
The Geothermal Energy Advancement Act, or H.R. 5631, passed with broad support on Tuesday. The legislation — led by U.S. Reps. Jeff Hurd (R-Colo.) and Susie Lee (D-Nev.) — includes the text of six bills that tackle some of the key permitting and regulatory challenges that companies face when building and scaling geothermal systems.
The measures “seem like low-hanging fruit, but they can actually make a tangible difference as we try and develop projects,” Ben Brenner, who leads federal policy and outreach for the geothermal startup Zanskar, told Canary Media. “It’s a huge milestone for these bills to pass the House.”
Also on Tuesday, the House separately passed another geothermal bill — sponsored by Rep. Russ Fulcher (R-Idaho) — that aims to increase the frequency and consistency of geothermal lease sales on federal land.
America has been converting earth’s heat into electricity for nearly 70 years, beginning with The Geysers power plant in Northern California. Yet the carbon-free energy source still accounts for only 0.4% of the nation’s annual electricity generation, largely owing to geographical constraints.
A new generation of technologies has made it possible to extract heat from places without simmering hot springs and natural reservoirs. The startup Fervo Energy, which just went public, uses drilling techniques from the oil and gas industry to produce clean power from hot dry rocks. Zanskar combines artificial intelligence with boots-on-the-ground surveying to identify conventional but hidden heat resources in the U.S. West.
But so far, the federal government hasn’t adapted to meet the rising demand from developers for permits, land leases, and legal certainty, experts say. Over 90% of identified U.S. geothermal resources are beneath public lands, making the Department of the Interior a crucial player in the emerging industry’s growth.
“As technologies evolve, so must the regulatory landscape,” Terra Rogers, senior director of the Clean Air Task Force’s superhot rock geothermal program, said in a statement. She applauded Congress for taking practical steps toward “unlocking next-generation geothermal.”
Now, the geothermal bills head to the Senate, though it’s unclear when or how the chamber will act, E&E reported. However, Brenner said he sees “a real pathway toward Senate passage, whether as standalone legislation or as part of a broader permitting package.”
Originally, Hurd introduced H.R. 5631 to improve Interior’s own expertise on geothermal issues, including by creating the role of “ombudsman” — a point person within the Bureau of Land Management who can clear up confusion and resolve disagreements among field offices about geothermal permitting decisions.
The amended bill that passed this week also folds in five other measures:
Rep. Alexandria Ocasio-Cortez (D-N.Y.), who sponsored H.R. 398, said that speeding up geothermal deployment could help alleviate the nation’s skyrocketing electric bills. “At a time of extreme political polarization, this package shows that Congress can still come together on commonsense solutions to better the lives of the American people,” she said in a press release.
The measures will also likely benefit the developers of power-hungry data centers, such as Google and Meta, which are investing in geothermal projects to support their growing operations in Nevada and New Mexico, respectively. Both firms are members of the Corporate Energy Buyers Association, a trade group that advocates for a carbon-free energy system.
“There are few energy technologies that draw this level of bipartisan support, but geothermal energy is a reliable domestic resource with enormous potential to fuel our nation’s electricity needs,” Rich Powell, CEO of the association, said in a statement.
Geothermal’s ability to churn out power 24/7 appeals to both Republicans and Democrats grappling with energy-supply crunches in their states, though wind and solar paired with batteries can also deliver firm power in certain ideal locations. Late last month, a bipartisan group of governors from Arizona, Colorado, New Mexico, and Utah launched a coalition to ease financial and logistical hurdles that stand in the way of building potentially hundreds of gigawatts of geothermal capacity in the Mountain West.
Geothermal’s strong overlap with the oil and gas industry — in terms of tools, workforce, and investors — is another key reason why the Trump administration has shown support for the renewable energy source, even as it works to block wind and solar development.
Beyond the House bills, Brenner noted that other, bolder policy measures are needed to dramatically increase the scale and pace of next-generation geothermal deployment in the U.S. That could include increasing federal funding for research and exploration — efforts that are largely backed by equity and venture capital today — as well as for demonstration projects that help de-risk geothermal development in new areas.
“This is an incredibly positive step, but it is not the full picture,” he said of the legislation. “There’s a lot more work that has to happen.”
An update was made on June 3, 2026, to include Rep. Russ Fulcher’s legislation.
Three electric school buses will kick-start the state’s groundbreaking vehicle-to-grid pilot program once school’s out, with more EVs to be added in the coming months.
After the school year ends in the Massachusetts towns of Acton and Boxborough, the district’s electric buses will mostly stay put in a parking lot. But they won’t sit idle all summer.

The three vehicles will charge up their nearly 200-kilowatt-hour batteries overnight, when the power supply is at its cleanest and cheapest, then send energy back to the grid from 4 p.m. to 7 p.m. on days when the grid is strained. The district will earn revenue for the power it shares, perhaps even enough to cover the costs of charging up during the school year, said Kate Crosby, energy manager for the Acton-Boxborough school district. Plus, the strategy will help lower the emissions and cost of the region’s electricity supply.
“The more we plug in batteries to the grid, the less we use peaker plants,” Crosby said. “They will help to stabilize the grid, help to reduce the cost of electricity for all ratepayers, and they’ll help make the grid cleaner.”
Acton-Boxborough’s school buses are the first vehicles to plug in to a Massachusetts program that aims to demonstrate and investigate the potential of “vehicle-to-everything” technologies, more commonly known as V2X. These systems use bidirectional chargers, which can power up a vehicle as well as send the energy stored in an EV’s battery back to a building or the grid.
Supporters say V2X technologies can yield a host of benefits. They can lower emissions by using stored energy generated at times when the grid is consuming less fossil fuel. They can help users offset their electricity bills by compensating them for power sent to the grid. They contribute to resilience when the power goes out. Plus, they can keep prices lower for everyone by sending cheaper power to the grid during times of high demand.
So far, however, widescale adoption has been elusive. Pilot programs across the U.S. and abroad have tested the possibilities, but they haven’t gained much traction in the face of high upfront costs, technical complexity, the huge variation among what equipment works with what vehicles, and the lack of established plans to compensate users for the power they pour back into the grid.
Massachusetts hopes its initiative will make some headway against these obstacles. At an event last week, the planners behind the demonstration program discussed what they’ve achieved so far, what they’ve learned along the way, and what problems remain.
The Massachusetts Clean Energy Center, an economic development agency, announced the demonstration program in early 2025, with the goal of giving away up to 100 bidirectional chargers to a variety of users. Participants were announced in February 2026: five school districts, four municipalities, and 30 residents. In order to understand how the systems function in a wide range of settings, the planners selected projects in all geographical corners of the state, and in rural, urban, and suburban areas served by 10 different utilities. The installations will include six different types of chargers plugging into eight different vehicles, from buses and pickup trucks to SUVs and compact hatchbacks.
“It’s not just about getting the right vehicle and the right chargers,” said Sally Griffith, transportation electrification program manager for energy consulting firm Resource Innovations, which is working with the state to run the program. “It’s about the whole system — how all of this needs to work together,” she said at the event.
Between 10 and 15 chargers are now installed and awaiting authorization to begin bidirectional charging. The rest are expected to be online by September.
Already, some challenges have been identified. The most pressing, speakers at the event said, have to do with finding a financial model that works.
For one, the systems are pricey: $15,000 to $40,000 for a residential setup, the Massachusetts Clean Energy Center estimates. Pilot programs can help defray costs for small numbers of users for a limited time, but a long-term, reliable compensation plan is needed to get any meaningful number of EV owners to make the leap.
But it turns out those compensation programs can be tricky to design. In Massachusetts, one major discovery so far has been the conflict between state solar incentives and the ConnectedSolutions program, which compensates battery owners for sending power onto the grid. Existing technology can’t tell the difference between electrons sent from solar panels and those coming from batteries. For a home with both solar panels and a bidirectional charger, it would be impossible to separate the solar power that should receive net-metering incentives from the EV battery power that would receive payment from ConnectedSolutions.
The Massachusetts Clean Energy Center had to immediately disqualify roughly 75% of the nearly 300 residential applicants for the V2X program because their homes had solar power, said Elijah Sinclair, the center’s senior program manager.
The state was aware there might be a conflict, but the scale took program planners by surprise, delaying the selection of participants and therefore the deployment of chargers.
One possible answer could lie in a program that compensates virtual power plants — networks of distributed energy resources like solar panels, batteries, and demand management — rather than providing different incentives for each component of the system, Steve Letendre, senior adviser at the Vehicle-Grid Integration Council, an EV charging advocacy group, told event attendees.
“We believe it’s a mechanism by which we can bring EVs onto the grid in a way that maximizes their value,” he said.
An unexpected bright spot so far has been the ease of interconnection, the process of formalizing agreements with utilities for hooking up an energy resource to the grid, Sinclair said.
“Utility interconnection was expected to be a big barrier,” he said. “But everyone has been just awesome to work with, and interconnection hasn’t slowed us down.”
The Massachusetts Clean Energy Center will collect data from participants for the rest of the year. By the end of the year, it aims to publish a comprehensive guidebook on what it’s learned about the cost, system design, and technical and regulatory barriers, with the goal of helping other agencies and states replicate the program.
In the meantime, the students and bus drivers of Acton-Boxborough will be enjoying quieter rides without any diesel fumes, said Crosby, the district energy manager.
“We are improving their quality of life immediately, and helping to create a cleaner, more stable future for them,” she said. “There’s nothing that matters more to us.”
New U.S. regulations and a wave of startup interest are breathing new life into TRISO-fueled reactors, which have struggled to take off due to high fuel costs.
As the U.S. looks to revive its stagnant nuclear industry, a group of companies is racing to realize the promise of a “meltdown-proof” fuel that for decades has struggled to progress beyond federal lab experiments.

Tri-structural isotropic fuel, known as TRISO, is safer and more stable than the fuel rods used by the large-scale water-cooled reactors that make up the vast majority of the world’s nuclear power plants. Both fuel sources use enriched uranium, but in TRISO, the element is balled into poppyseed-sized spheres with ceramic coating that can absorb dangerous radioactive materials.
The hitch is the cost: TRISO is orders of magnitude more expensive than conventional assemblies of low-enriched uranium. Given that hefty price tag, only a few TRISO-fueled reactors have ever been built worldwide, even though the technology has existed for years and the world is hungry for nuclear projects that promise to avoid the worst accidents of the past.
But renewed interest is growing as TRISO producers claim they can cut the cost of the fuel by as much as 50% in the coming years, and as a growing number of companies make progress building reactors that can demand that supply.
In mid-May, the U.S. Nuclear Regulatory Commission made history when it advanced a new nuclear plant with a mere monthslong environmental assessment rather than the yearslong environmental impact statement required of every other atomic power station in the country. Regulators said they moved faster in part because the 80-megawatt design from the next-generation developer X-energy relied on TRISO.
But X-energy is not the only developer seeking to use TRISO.
One of the two new nuclear plants currently under construction in the U.S. is a TRISO-based design from Kairos Power. Of the nearly two dozen U.S. startups hawking next-generation reactor designs, at least seven companies are aiming to build fission plants that run on TRISO.
New licensing pathways at the NRC could also give TRISO a boost, as the fuel’s well-documented safety qualities make permits easier to come by for the startups using it.
The momentum comes as public support for nuclear power reaches its highest level in years in the U.S. Some advocates see nuclear energy as a necessary tool to meet surging power demand, while others — particularly blue-state lawmakers and environmental groups that have abandoned anti-nuclearism — view the most reliable carbon-free energy source as a bedrock of a future electrical grid free of fossil fuels.
The 94 operating nuclear reactors in the U.S. are all large-scale models that are cooled by water; most of them were designed and built more than a half century ago. Firms looking to develop reactors that run on TRISO are part of a broader wave of startups that think the best way to build new atomic energy is by pursuing lower-powered small modular reactors, whose designs can be refined and made cheaper through assembly-line repetition.
Companies looking to go the route of microreactors and small modular reactors, however, face not only the challenges that plague large-scale reactors, such as pushback over radioactive waste and costly fuel sources, but new ones, too. For TRISO, those challenges are cost and an immature supply chain — plus the fact that the fuel’s performance remains largely untested at any commercial scale.
Research on TRISO began in the late 1950s in the United Kingdom. At the time, British nuclear regulators had started work on the so-called Dragon reactor at a U.K. Atomic Energy Authority site in Dorset, England. Cooled with pure helium, which can absorb three to five times as much heat as water, the high-temperature gas-cooled reactor needed a fuel that could match its heat tolerance. Thus, TRISO was born.
The first attempts to run a reactor on TRISO worked. The British Dragon ran on the fuel, as did similar experimental high-temperature gas-cooled reactors completed in the 1960s, such as Peach Bottom Unit 1 in Pennsylvania, Germany’s Arbeitsgemeinschaft Versuchsreaktor, and Japan’s government-owned high-temperature test reactor.
But the market remained tiny. Of those four midcentury test reactors, just the Japanese unit remains in operation. In Colorado, the Fort St. Vrain nuclear plant, the only American attempt at commercializing a high-temperature gas-cooled reactor running on TRISO, shut down in 1989 after a decade of high maintenance costs and frequent technical troubles.
Right now, the only commercial TRISO-fueled reactor in the world is in China. It came online in 2023 and uses a form of the fuel based on low-enriched uranium, rather than the more potent high-assay low-enriched uranium, or HALEU, that many U.S. firms are eyeing.
The small number of TRISO-fueled reactors has made it hard for fuel companies to dedicate any space or capacity to producing the fuel, and has kept prices high as a result. TRISO costs an estimated $30,000 per kilogram — more than nine times the roughly $3,300 per kilogram for conventional fuel.
These fuel costs can be offset in part by the fact that TRISO designs don’t need to build expensive concrete containment domes. A reactor’s containment dome alone, after all, made up on average about 4% of the total upfront costs for reactors built between 1976 and 1987, according to a 2020 study in the journal Joule. And that doesn’t include the cost of the steel containment vessel that encloses the reactor under the dome. Nor does it account for the fact that, as the study concluded, productivity at recent U.S. plants — likely meaning the infamously budget-busting pair of gigawatt-sized Westinghouse reactors at Southern Company’s Plant Vogtle in Georgia — was 13 times lower than industry expectations.
While there’s no obvious magic number on which the economics hinge, producers agree that the TRISO market will not take off until the fuel is produced at a large enough scale to significantly bring down costs.
X-energy, for its part, owns a TRISO-manufacturing subsidiary to ensure its own fuel supply. It plans to get the facility online by as soon as next year and said it’s using a standard fuel design honed as part of a decades-long DOE program to support research into the fuel.
BWX Technologies, the nuclear fuel giant that generates fuel for the U.S. government, is currently working on a dedicated $500 million plant to manufacture the fuel in Gillette, Wyoming.
If operations begin as expected by 2031, the plant alone would slash the price of TRISO in half, said Erik Nygaard, BWXT’s director of product development. Recent supply contracts from firms including Antares and Kairos have buttressed BWXT’s investment plans for the facility.
“If you’re making hundreds of kilograms a year in a factory that has all this other cost and overhead, and then you go to a dedicated factory that’s completely designed around how you want your process flow, you get to spread your cost over a much, much greater volume,” Nygaard said. “It doesn’t take a lot to make the economics work. The problem has just been needing enough demand booked to put the shovel in the ground and build this really big facility.”
TRISO-based designs may be at a disadvantage when it comes to fuel cost and supply — but in the U.S., a series of recent regulatory moves have given this class of reactors a leg up when it comes to permitting.
In March, the NRC made the first major update to its licensing standards since 1956 — the culmination of an effort to speed up nuclear licensing that started with a bipartisan law signed by former President Joe Biden and that has been accelerated under President Donald Trump.
Known as Part 53, the licensing pathway allows developers of next-generation technologies to assess the safety of reactors through a risk-informed analysis. It’s a less prescriptive approach than the traditional pathways, which were written to account for the specific safety concerns that come with building a conventional, large light-water reactor.
That new flexibility could benefit TRISO-based designs. Part 53 offers an open-ended option to prove, for example, that the inherent qualities of a TRISO-based design may make it unnecessary to build an expensive concrete containment dome for a reactor.
“Absolutely, there are substantial safety benefits to using TRISO,” said Jeremy Bowen, the head of the NRC’s newly created Office of Advanced Reactors.
In fact, when the NRC greenlit construction permits for the first two demonstration units Kairos Power is building at its debut plant in Oak Ridge, Tennessee, the agency cited the unique safety of the Google-backed developer’s molten salt-cooled, TRISO-fueled reactors. Those reactors, under construction with a target commissioning date of 2030, are the first TRISO-based reactors underway in the U.S since Fort St. Vrain, which closed 37 years ago.
“We were able to credit the safety of TRISO,” Bowen said of assessing Kairos’ applications.
The combination of the molten salt coolant, which can reach much higher temperatures than water, and the TRISO fuel amount to what the NRC called “functional containment design,” meaning a meltdown was so impossible to fathom that a concrete dome over the reactor wasn’t needed.
“Those aspects gave us confidence there was minimal risk of a radiation release and public safety concerns for impacts on the environment,” Bowen said.
The newly proposed Part 57 — another licensing pathway the NRC designed for smaller reactors — also peels back some of the initial safety layers that apply to traditional atomic stations, including both concrete containment domes and miles-wide emergency planning zones.
The NRC created both Part 53 and the proposed Part 57 in large part to speed up permitting processes for smaller nuclear reactors. But these pathways may be viable only for the crop of next-gen nuclear firms that use TRISO in their designs.
To use a licensing pathway such as Part 57, for example, a developer would need to prove that an accident would risk the release of less than 1 rem of radiation, the same amount the human body gets from a CT scan, throughout the duration of the incident.
“TRISO, according to the NRC, is its own containment vessel,” said Adam Stein, the director of nuclear energy innovation at the Breakthrough Institute. “It would be difficult for a different fuel source to meet that 1 rem criteria.”
Other firms may be forced to rely on the traditional, slower-moving Part 50. It’s not a death sentence — X-energy opted for that approach for both of its debut power stations — but other developers have complained that Part 50 puts them at a disadvantage in terms of timing, and requires pushing back against measures in the process that were designed for large water-cooled reactors.
The safety features of TRISO are all the more appealing given that many nuclear startups are staffed by people with no prior experience working with reactors, said Paul Dickman, an expert at the American Nuclear Society and the former chief of staff to the NRC chair from 2006 to 2010, the last time the U.S. had planned to embark on a large buildout of new reactors.
Under the new regulatory structures, “you’re putting a lot of reliance on the fuel — that’s your primary defense mechanism,” Dickman said.
“This is a bunch of guys who don’t have pilot’s licenses designing airplanes. That isn’t to say their airplane isn’t going to fly, but there’s a lot of things you learn from experience,” he added. “To them, it’s all about reinventing everything. That’s a problem.”
But a solution, he said, is turning to a fuel that has inherently safe properties — even if it comes with different challenges in terms of cost and availability.
For his part, Dickman expects the market for TRISO to expand in response to the new regulatory options.
Kurt Terrani, the chief executive of the TRISO manufacturing startup Standard Nuclear, also expects the same.
“They’re not saying you have to use TRISO, but it’s pretty, pretty easy to arrive at the fact that if you really want to meet the limits, it behooves you to use TRISO,” he said.
Led by New York, the attorneys general argue that the administration’s agreement to reimburse the energy giant for abandoning its offshore wind leases is illegal.
New York and six other Democratic-led states are challenging the Trump administration’s controversial efforts to pay private energy firms to abandon their U.S. offshore wind projects.
On Tuesday, the coalition of blue states sued the U.S. Department of the Interior over its March agreement with French oil giant TotalEnergies. Under the deal, TotalEnergies forfeited its lease for a large offshore wind area near New York and New Jersey. In exchange, Interior said it would “reimburse” the company for the $795 million it paid in lease fees, money that TotalEnergies promised to put toward fossil fuel projects.
At the time, former Interior employees and offshore wind experts questioned whether the department could legally carry out its unprecedented payback plan. Now, attorneys general from seven states are calling it an “unlawful” agreement that misuses taxpayer dollars. The action came after the government tried repeatedly and ultimately unsuccessfully to block construction of offshore wind farms along the East Coast.
“The Trump administration is once again trying to kill clean energy projects and destroy good-paying jobs for New Yorkers,” Letitia James, the New York attorney general, said on Tuesday in a statement.
New York is joined in the lawsuit by Connecticut, Maine, Massachusetts, New Jersey, Rhode Island, and Vermont, which claim that the lease cancellation harms the states’ economies, power grids, and climate targets. State leaders and utility regulators in the region had been anticipating a massive influx of offshore wind power from projects like TotalEnergies’ to meet their soaring electricity needs in the coming years, especially during fierce winter storms and heat waves that threaten sweeping blackouts.
“New Jersey needs more power supply,” Jennifer Davenport, the New Jersey attorney general, said in a statement to Canary Media. “The federal government’s lawless attack on clean energy development is bad for the grid, for our economy, and for ratepayers.”
In 2022, a subsidiary of TotalEnergies, called Attentive Energy, won a lease for over 84,000 acres off the coast of New York and New Jersey through a competitive federal auction, which drew the highest bids in the nation’s history. TotalEnergies said it aimed to develop over 3 gigawatts of offshore power in the large, shallow swath of ocean and provide clean electricity for more than a million homes across the two states.
The five New England states joining the lawsuit were also slated to benefit from the wind farm, since they regularly import energy from New York through a high-voltage interconnection, according to their filing with the U.S. District Court for the District of Columbia.
Interior officially canceled Attentive Energy’s lease in April, saying it was acting in the public interest.
TotalEnergies signed an identical but separate deal with Interior this spring to cancel the $133 million lease for its planned 1-GW Carolina Long Bay wind farm near North Carolina. Another developer, Ocean Winds, has also inked agreements to relinquish offshore wind leases near California and in waters off New York and New Jersey, which totaled nearly $900 million.
This week’s lawsuit could provide a “roadmap” of sorts for other states looking to fight the Trump administration’s lease-cancellation deals, said Tony Irish, a former Interior attorney who now works for the organization Public Employees for Environmental Responsibility.
“I’ve been hoping for this day, and I’m glad that it’s here,” he said, adding that the New York–led lawsuit “brings a phenomenal array of valid claims” against the agreement with Attentive Energy.
In their suit, the attorneys general argue that the Trump administration’s arrangement violated the Outer Continental Shelf Lands Act, which limits Interior’s ability to cancel offshore wind leases and requires the department to hold a hearing weighing the pros and cons. The coalition also maintains that Interior violated the Judgment Fund Act because of how it paid back TotalEnergies’ $795 million in lease fees. The fund uses taxpayer dollars to settle lawsuits and claims against federal agencies, but the two parties aren’t settling any active litigation.
The attorneys general are asking the D.C. court to strike down the agreement, vacate the lease cancellation, and stop the Trump administration from taking further steps to implement the deal.
Interior, for its part, defended its actions with the offshore wind developers.
“Let’s be clear: these were voluntary agreements,” a spokesperson said by email on Tuesday. “No one was forced to sign them. Moreover, these settlements were reviewed and approved by the Department of Justice, underscoring that they went through the appropriate channels.”
The DOE says the Schahfer plant is key for reliability, but repairs mean it’ll be offline for much of 2026. The grid is set to be just fine without it this summer.
The Trump administration has spent the last year demanding that old, inefficient coal plants stay online long past their retirement dates. But one of those plants in Indiana hasn’t operated in months and won’t be able to until costly repairs are completed — undermining federal officials’ claims that their mandates will make energy more affordable and are needed to avoid imminent blackouts.

The Trump administration first ordered Indiana’s R.M. Schahfer coal plant to continue running in December, just a week before its scheduled closure date and after regulators had already determined that the polluting plant was not needed to keep the region’s lights on. That 90-day emergency must-run order was reupped on March 23.
Yet the coal plant has been offline for repairs since the end of February and is not expected to start running again until this fall, facility owner Northern Indiana Public Service Co. (NIPSCO) told regional grid operators at their May 19 hearing on summer electricity reliability. The utility added that even without that energy, it is well positioned to meet power demand this summer, in large part thanks to new wind, solar, and batteries.
In other words, “the coal-fired units couldn’t produce electricity for an emergency even if one existed, which it doesn’t,” Sameer Doshi, a senior attorney for the nonprofit law firm Earthjustice, said in a statement. Earthjustice is asking a federal appeals court to overturn the administration’s must-run orders for Schahfer and another Indiana plant.
In total, President Donald Trump’s Department of Energy has ordered seven fossil-fueled plants in the U.S. to run past their retirement dates — sometimes against the wishes of the plant owners themselves — in an unprecedented flex of authority under Section 202(c) of the Federal Power Act. The agency had previously used that power only temporarily on request from utilities and grid operators facing immediate energy threats.
Even before the DOE ordered Schahfer to stay online, one of the plant’s two coal-fired units had been out of service since July 2025 because of mechanical failures.
The plant’s other coal-fired unit operated in January, helping to meet demand during Winter Storm Fern. But it has been offline since Feb. 28 for “planned maintenance,” NIPSCO said. Both units are scheduled for a “tentative” return to service by October, company officials said at the May forum held by the Midcontinent Independent System Operator (MISO), which operates the grid covering parts of 15 states.
“The conditions of both those units were deteriorated,” said NIPSCO environmental compliance director Rockey Pollard, citing issues with equipment including boiler feed pumps and tubes, as well as last summer’s turbine failure.
The company told MISO that “significant boiler and turbine work” is ongoing on both coal units, which were built in the mid-1980s.
Households and businesses will bear the financial brunt of propping up coal plants, which are more expensive to operate than newer gas plants and renewable energy paired with batteries. In March, federal regulators approved NIPSCO’s request to spread the costs of the coal plant repairs among customers across the north and central part of the region. The company has estimated that keeping the coal plant running past its 2025 scheduled retirement date will cost more than $1 billion through the end of 2027.
Local residents are also furious that, along with keeping Schahfer running, NIPSCO is planning to develop a massive data center, and a gas plant to power it, adjacent to the coal plant.
While experts are skeptical of the Trump administration’s “energy emergency,” the U.S. does need to quickly build generation as data centers, factories, and electrification spike demand. But many say wind and solar — the cheapest, fastest types of electricity to build — are the solution, rather than running antiquated coal plants.
NIPSCO, for one, explained at the hearing that it expects to have a surplus of power in the coming months, and that it had added three wind farms, eight solar farms, and two battery sites to its portfolio since 2021. Across MISO’s territory, solar and storage plants — along with some new gas plants — mean that the grid is prepared to meet demand over the summer, the organization reported this month.
“The DOE is using 202(c) emergency orders to force ratepayers to pay for plant rebuilds at this dilapidated coal plant even as Indiana regulators have already approved replacement power plants, which are now operating or under construction,” Earthjustice’s Doshi said.
The Trump administration is expected to issue yet another 90-day must-run order at Schahfer when the current one expires on June 21. But as NIPSCO has made clear, the coal plant won’t be able to run at all for the entirety of that three-month mandate.
Consumers “will be forced to absorb additional costs for facilities that are not delivering any benefit to the public,” Kerwin Olson, executive director of the Indiana consumer watchdog group Citizens Action Coalition, said in a statement. “Ratepayers need relief, not further punishment.”
Air regulators say the new plan balances industry needs and environmental goals — but critics worry that the state has just undermined its own emissions targets.
The California Air Resources Board on Friday approved major changes to the state’s cap-and-invest program, including a controversial plan to allow polluting industries to earn free emissions allowances if they invest in decarbonizing their facilities — a move critics say could undermine California’s decarbonization goals.
Friday’s vote capped months of fighting between environmental groups and polluting industries over the future of the state’s two-decade-old carbon-trading regime, which lawmakers reauthorized last year. Companies covered by the program must either reduce their carbon emissions below a certain state-mandated limit or buy allowances from the market to offset emissions in excess of that limit.
CARB’s initial proposal in January came under fire from several polluting industries, which warned they would have to raise prices or shutter operations given the cost of meeting its increasingly stringent emissions limits. Oil companies such as Marathon Petroleum and Chevron threatened to close some of the state’s last remaining oil refineries.
The January proposal also included cuts to programs funded by cap-and-invest meant to offset rising electricity costs via utility customer credits. California utilities and lawmakers protested changes to that program, which was part of a sprawling energy affordability package passed last year.
CARB issued a revised plan in April that both increased funding for utility bill credits and set aside about $800 million in additional compliance support to polluting industries. The April plan put forward CARB’s manufacturing decarbonization incentive (MDI) program, which will make free allowances available to companies that invest in cutting carbon emissions.
Environmental groups and state lawmakers opposed the MDI proposal, which they fear will threaten the cap-and-invest program’s ability to help California meet its near-term target of reducing carbon emissions by 40% from 1990 levels by 2030.
In response, CARB added last-minute amendments to tie allowances to proven carbon-cutting projects. It also stipulated that the plan will be rolled out in stages so that staff and board members can ensure it’s working as intended before the new rules take effect statewide.
Still, these guardrails were not enough to quell concerns from critics.
“These changes to Cap-and-Invest allow more pollution and undermine the program’s ability to support investments that cut emissions and costs for families,” Katelyn Roedner Sutter, California senior director for the Environmental Defense Fund, which opposes CARB’s plan, said in a Friday statement.
CARB Chair Lauren Sanchez said Friday that the updates represented a “challenging balancing act” between meeting climate targets, improving energy affordability, and supporting industries important to the state’s economy. Offering hard-to-decarbonize industrial facilities a way to reduce the cost of complying with the state’s increasingly stringent emissions caps could help dissuade them from leaving the state, she said.
The MDI, which could provide up to $4 billion in value for companies tapping into it, could also help make up for the billions of dollars of federal industrial decarbonization funds stripped by the Trump administration, Sanchez said. “The federal attacks on that funding are unprecedented, and we are fighting many of them in court, but this part of the proposal can help to backfill some of that investment,” she said.
Gov. Gavin Newsom has also framed California’s cap-and-invest program as a pushback against the Trump administration’s attacks on the state’s clean vehicle regulations and other climate efforts.
“While Trump sows ongoing chaos and uncertainty, California is staying focused by protecting our economy, safeguarding public health, and doubling down on the clean energy future,” Newsom said in a Friday statement praising CARB’s vote.
Critics of the new plan worry that MDI will undermine climate goals for a simple reason: It could let major polluters emit more greenhouse gases than they ought to.
In January, CARB determined that the cap-and-invest program had to remove allowances equivalent to 188 million metric tons of emissions from circulation in order to meet its 2030 decarbonization targets. But the MDI program would keep those allowances in circulation — and give them away for free to companies that invest in carbon-cutting projects, even though those might not deliver emissions reductions until later.
The MDI could also sap funding for some of the climate and energy programs cap-and-invest helps pay for.
Lawmakers, academic experts, and community advocates warned that the MDI could depress prices in California’s carbon market, thereby reducing the revenue cap-and-invest raises for the state’s Greenhouse Gas Reduction Fund. GGRF has become a catchall source of alternative funding for programs facing cuts in the state budget over the past several years.
In particular, the programs CARB has designated as “Tier 3” could lose their funding if carbon market revenues fall. That amounts to hundreds of millions of dollars for affordable housing, low-carbon transit, and clean air and drinking water for low-income communities.
At Friday’s meeting, board members grilled CARB staff for hours over this risk. Rajinder Sahota, CARB’s deputy executive officer for climate change and research, asserted that analyses from environmental advocates and the state’s Legislative Analyst’s Office, which predict the MDI program could lead to billions of dollars of lost carbon-market revenue, have overestimated the likely financial impacts.
But Kyle Meng, a professor at the University of California at Santa Barbara who co-authored an analysis that found the MDI could lead to $2.3 billion less for the GGRF and $1.7 billion less for the California Climate Credit from 2027 to 2030, pushed back against those assertions in a social media post after Friday’s vote.
“Seeing such voodoo economics coming from the agency tasked with governing the world’s second most valuable carbon market was disappointing, to say the least,” Meng wrote.
Sanchez agreed at Friday’s hearing to insert several last-minute amendments, which were proposed by other board members to forestall the risk of MDI undermining state carbon-reduction targets or throttling carbon market revenues.
For one, CARB can claw back allowances if companies don’t follow through on the decarbonization investments they’ve promised, Sanchez said.
Another provision will require CARB’s executive officer to report to the board before any allowances are awarded, to give board members an opportunity to amend the MDI program’s workings to avoid deep hits to carbon market revenues or the integrity of the cap. Sanchez described the changes as “pushing pause on the MDI” pending “analysis that is then reported back to us as a board and any changes and amendments that are needed.”
It’s unclear how these changes might affect the debate over funding for GGRF-reliant programs that’s currently raging in the state capitol.
State Sen. Henry Stern, an ex officio CARB member, brought up this issue at Friday’s hearing, noting that recent proposals from the state Senate Budget Committee are ready to “reject the current expenditure plan” absent more guarantees that the MDI would not undermine program funding.
Even so, Stern, who was among more than two dozen other lawmakers who signed a letter protesting CARB’s April plan, expressed support at Friday’s hearing for an MDI program that could backfill lost federal funding for the toughest-to-decarbonize part of the state’s economy.
“This has serious potential to be a core accountability tool for our justice communities, looking for not just GGRF to take care of their problems but for the polluting entities themselves to pay for them,” he said. “And I, frankly, don’t think we’re going to be able to hit both our targets in this sort of broader transitions that we want to see unless we bring serious private capital to the table.”
A majority of board members voted down a proposal to delay adoption of the new rules after CARB staff warned that revising the plan to exclude the MDI could force the agency into a monthslong process that could prevent it from reauthorizing the program by a September deadline, which would in turn trigger an even longer administrative review. Such delays could do more harm than good to confidence in the carbon market and further depress revenues, Sahota said.
Ultimately, the board voted 10 to 3 to adopt the plan. The MDI program will open to applications from companies in mid-2027.
The guardrails didn’t satisfy Lynda Hopkins, who joined board members Diane Takvorian and Gladys Limón in voting against the updates.
“My concern is that this proposal comes at the expense of zero-emission transit, affordable housing, clean air, clean water, increased gas, greenhouse gas emissions, and potentially community emission-reduction plans,” Hopkins said.
But CARB board member Cliff Rechtschaffen said he supported the program with the changes inserted on Friday, including several he proposed to tie allowances to specific facilities that prove they’ve invested in effective decarbonization projects.
“I don’t support a delay, because of the risks and uncertainties my colleagues have outlined,” Rechtschaffen said. “I think the risks on the market are real. We live in a very volatile world, and a regulation in the hand is worth maybe one and a half or two in the bush.”
The legislation expands subscription-based solar farms from 250 to 875 megawatts and is the product of the state’s “new affordability politics.”
When Steve Ault got an offer about six years ago to lease a bit of his 100-acre family farm in Prince Edward County, Virginia, for solar panels, he let the letter sit on the kitchen table for a few days.
Then he showed it to his wife, Chris. “Well, shoot,” she recalled telling her husband. “Let’s give them a call and see what they’ve got to say.”
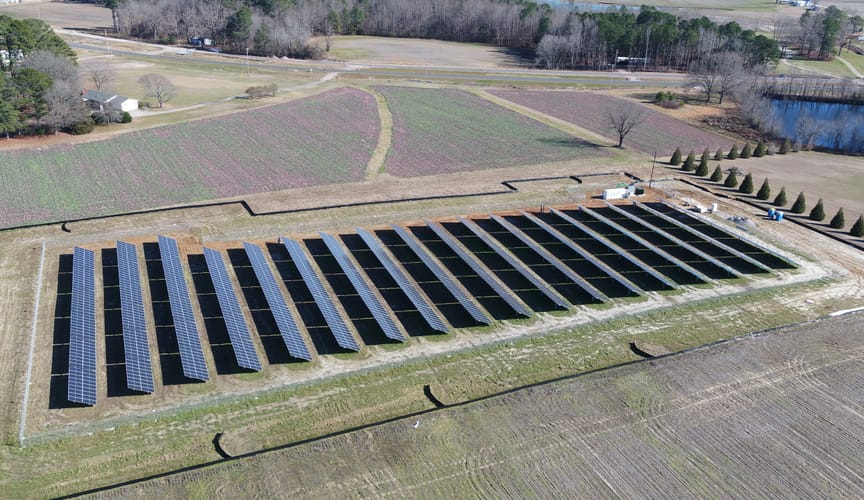
The couple ultimately agreed to rent 20 acres of their pastureland to developer Dimension Energy for a small, 5-megawatt solar array, nestled behind a nearby railroad track and far from public view. Called a “shared solar farm,” it serves customers who subscribe through their utility, Dominion Energy.
As groundbreaking neared, they took some initial flak from their neighbors in this bucolic county on the edge of Amish country, about 80 miles from Richmond.
“We saw the signs going up,” Steve said, which read “Stop the solar grab.” But now, the couple believes, some of those same neighbors are probably envious. After all, the duo, who began raising hogs, sheep, and other livestock two decades ago as a second career, have netted tens of thousands of dollars each year on the panels, which began sending power to the grid in February 2024. The funds have enabled them to retire comfortably.
“They’re going to pay three times what this farm’s worth at the end of the day,” Steve said.
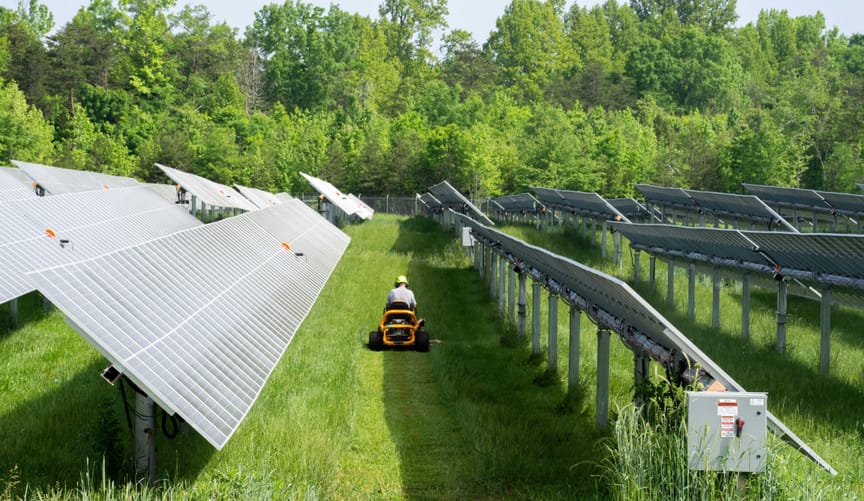
The grass beneath the panels in the solar field, a stone’s throw from the couple’s renovated 19th-century farmhouse, is maintained by an area shepherd and his 50-some sheep. All in all, Steve said, the solar array “has been such a win-win.”

Now, many more farmers can take advantage of the same opportunity, thanks to a pair of laws signed this spring by Gov. Abigail Spanberger, a Democrat who has made containing energy prices a focus of her administration.
The laws require Dominion and Appalachian Power, the state’s other investor-owned utility, to develop more shared solar farms — also known as community solar — like the one on the Aults’ property. Up to 5 megawatts in size, the arrays are partially financed by subscribers who want solar energy but don’t own their homes, have shaded roofs, or otherwise aren’t in a position to invest in their own panels.
“The Spanberger administration and the state legislature realized they had to tackle affordability,” said Brandon Smithwood, Dimension Energy’s vice president of policy. With shared solar, he said, “that comes on two fronts.”
For one, subscribers can lower their bills because solar is generally cheaper, and its costs are less volatile, than electrons produced from fossil fuels. Plus, Smithwood said, small solar farms are relatively quick to develop — adding valuable capacity as prices soar across the regional grid and data centers strain supply.
“You can tuck this in a farmer’s back 40 where it can’t be seen from a road,” Smithwood said, just as the Aults’ solar array is. “Standing up a program like this reduces both near-term and long-term energy costs that benefit all ratepayers” — even those who don’t subscribe.
Sponsored by northern Virginia Democrats Sen. Scott Surovell, the Democratic majority leader, and Del. Rip Sullivan, the two new statutes are the latest chapter on shared solar in Virginia.
In 2020, state lawmakers passed the Clean Economy Act, which required Dominion and Appalachian Power — known as APCo — to sell 100% carbon-free electricity by midcentury. That law directed Dominion to develop 200 megawatts of shared solar farms. A follow-up measure in 2024 required APCo, the smaller of the two utilities, which serves mostly southwest Virginia, to invest in 50 megawatts.
Consumers eagerly embraced the opportunity to take part in shared solar, according to the national trade group Coalition for Community Solar Access. In Dominion territory, the original 200-megawatt offering serves tens of thousands of residents across 52 projects. APCo’s version launched in 2025 and was almost immediately oversubscribed.
At the same time, dozens of renewable energy developers are waiting in the wings, ready to deploy more shared solar for both Dominion and APCo customers.
The new laws require the utilities to respond to all this interest. Under Senate Bill 254/House Bill 807, Dominion must make another 525 megawatts of shared solar available for consumers beginning this summer. Under Senate Bill 255/House Bill 809, APCo will improve its billing practices and offer up another 100 megawatts.
“This program expansion is a reflection of a new affordability politics,” Smithwood said, whereby policymakers are relying on clean energy and efficiency to lower utility bills, rather than doubling down on expensive fossil fuels.
Indeed, this year lawmakers passed, and Spanberger signed, a flurry of clean energy bills aimed at curbing costs. The measures include allowing plug-in balcony solar units, reining in local restrictions on large solar farms, and pushing for better utilization of the state’s existing network of poles and wires.
“‘Affordability’ is the word of the decade, of the year,” said Charlie Coggeshall, the mid-Atlantic regional director for Coalition for Community Solar Access. “We were grateful that community solar was recognized as part of the affordability solution.”
Data from the National Laboratory of the Rockies shows how the expansion to 875 megawatts could catapult Virginia to fifth in the country for shared solar, just behind Minnesota, which has one of the oldest such programs in the U.S.
Depending on how it’s designed, shared solar saves consumers around the country between 5% and 15% on their utility bills, while delivering millions of dollars in system-wide benefits by reducing the need for costly generation, transmission, and distribution investments.
But Virginia’s shared solar scheme has a key feature that distinguishes it from those in many leading states: Subscribers are charged a minimum monthly fee.
The concept, known as a minimum bill, is a concession by clean energy advocates, who tout the net benefits of the shared solar for all ratepayers. And in early versions of the Virginia program, the minimum was set so high that only those exempt from paying it — low-income customers — ended up subscribing.
Yet after years of debate and refinement, Coggeshall and others are hopeful that policymakers have finally set the right balance.
“The gist of it is you’re paying at least $25 or $50 on your electricity bill every month,” Coggeshall said. “It just ensures that the utility is always going to get paid: Essentially, you can’t zero out your bill.”
The lower minimum bill should invite more diverse participation among customers of all income levels.
“What’s exciting is, not only are we going to be able to serve more Virginians in terms of numbers,” Smithwood said, “but we’re going to be able to serve people of different incomes and different parts of the state.”
To wit: Dimension Energy expects the Virginia expansion to cut bills by at least 10% for another 125,000 households in the state.
Dominion and APCo will be still required to serve a set target of low-income customers. That, in addition to the economics and sustainability of solar, was a key draw for the Aults years ago.
“The energy we generate here serves low-income [households],” Chris Ault said. “I really like that.”

.svg)
