

This story was first published by the Missouri Independent.
The conversion of Missouri farmland from food to solar power production creates feuds among neighbors, pits residents against developers, and raises questions about property rights.
Those tensions were on full display Tuesday in the Missouri Senate commerce committee, which held hearings on two bills aimed at halting solar power development and a third that would impose new regulations and taxes on large-scale development.
No votes were held on any of the bills.
Laura Stinson told the committee her parents’ Callaway County home, once a peaceful respite, is now plagued with construction noise, dust, and blinding glare from a new development surrounding their 16 acres.
“They are running full steam ahead, and they don’t care who they run over,” Stinson said, pleading with members to pass the bills.
But Dane Reed of Vernon County said his decision to lease land to a solar developer is the best use of his property.
A moratorium, he said, “strips landowners of our fundamental right to choose our most profitable crop. And right now, solar energy generates twice the revenue of any other crop we can produce.”
Thousands of acres across the state are being used to construct large-scale solar projects, some for commercial sale of power and others that will be dedicated to supply other new developments like data centers.
State Senate President Pro Tem Cindy O’Laughlin, a Shelbina Republican, and state Sen. Sandy Crawford, a Republican from Buffalo, are sponsoring the moratorium bills. The bills would halt all work on commercial-scale solar power installations and direct the state Department of Natural Resources to issue rules on their “construction, placement and operation.”
The moratorium would expire Dec. 31, 2027, or when regulations become effective, whichever is later.
The goal of the moratorium, O’Laughlin said, is to force developers to make their plans known so residents can judge for themselves whether the project will benefit the community. Currently, she said, the public becomes aware of projects only after contracts are signed with landowners and the result seems predetermined.
“Communities become divided as the neighbors are pitted against one another, those who signed and those who don’t, and those who bear the environmental, visual, and infrastructure impact versus those who are being paid and receiving compensation,” O’Laughlin said.
The bill establishing regulations, sponsored by state Sen. Travis Fitzwater, a Republican from Holts Summit, would not halt current construction.
Instead, it creates a process for public notice and local approval at the county level that must take place before an application to proceed with a project is submitted to the Public Service Commission.
Without approval from a county commission, the application could not move forward.
Fitzwater’s bill would also tax solar power equipment, currently exempt from property taxes, as personal property. The land would also be taxed as commercial real estate instead of the cheaper designation as farmland.
The bill would cap the amount of land used for solar power production to 2% of the cropland in a county and block the Public Service Commission from granting solar power developers the right to condemn property for energy generation.
“I’m passionate about my constituents that come to my office that are crying over the fact their American dream is being stunted, and I want to provide a solution,” Fitzwater said.
There are 36 states that currently regulate new commercial solar power projects, said Kurt Schaefer, director of the Missouri Department of Natural Resources. Because the Public Service Commission regulates only investor-owned utilities, he said, his agency could be the regulatory agency because its authority can also be extended to electric cooperatives and municipal utilities.
The rules should govern both the setup and operation of solar facilities and what happens when their useful life is over, Schaefer said.
“In the state of Missouri, we require financial assurance for a whole lot of things — land reclamation, for mining activities, wastewater systems,” Schaefer said. “You really can’t even put in a small wastewater system for a trailer park without posting a bond.”
One of the most controversial projects is in Henry County, where there is a 5,000-acre solar farm under construction. The project was developed over several years but only revealed publicly at the start of 2024.
In December 2024, after two incumbent commissioners were defeated for reelection, the Henry County Commission approved an incentive package for the solar project that included $650 million in public-sponsored financing.
With the filing of the moratorium bills, construction has picked up pace, said former Henry County Prosecuting Attorney Richard Shields.
“These moratorium bills would give the state the opportunity to tap the brakes on these projects and get some rules in place,” Shields said.
A moratorium would end solar development in Missouri for years, said David Bunge of Azimuth Renewables, a solar energy development company in St. Louis.
“That’s not stability, that’s not good governance, and it’s not fair to the communities of Missouri that have engaged with developers like Azimuth,” he said.
And Mark Walter, a consultant for solar developers, said the moratorium bill is so broad it would prevent individuals from installing new solar panels on their home. The need for regulation is real, he said, but must be targeted against bad practices.
“There are plenty of bad developers out there,” Walter said. “I joked for a long time that I had a job in policy because of those folks, and I had to clean up their messes when they would make bad projects that upset local people and end up with state legislation like this.”
In Massachusetts, many natural gas customers are receiving what they say are the highest utility bills they’ve ever faced.
The reasons for these spiking costs are complex, ranging from volatile gas supply prices to this winter’s unusually frigid weather. Less discussed, however, is the effect of utilities’ Gas System Enhancement Plans, or GSEPs. The state requires these annual plans in an effort to make the gas pipeline system safer, but many lawmakers and climate advocates argue that utilities are taking advantage of the GSEPs to boost profits and build out fossil-fuel infrastructure Massachusetts doesn’t really need as it transitions to clean energy. Most residents likely don’t even know GSEPs exist, but the costs have escalated in the 12 years they have been in effect, and now make up roughly a tenth of gas customers’ monthly bills.
The program was created in 2014 to address growing safety concerns about the dangers posed by leaks in Massachusetts’ natural gas pipes, which are among the oldest in the country: One out of every four miles of pipeline in the state was installed before 1940.
As gas pipes get older, they become more prone to catastrophic breaks that can cause explosions, like the one in San Bruno, California, in 2010. Natural gas leaks also release planet-warming methane and other hazardous compounds, like benzene and xylene, said Jonathan Buonocore, an assistant professor of environmental health at Boston University.
“Many of these are health-damaging pollutants, and some are carcinogenic,” he said.
Massachusetts decided to address the problem by, in short, allowing utilities to make more money, more quickly when they repair or replace leak-prone pipes.
In general, gas utilities’ profits come from the delivery portion of their rates. They invest in pipes, compressor stations, and other infrastructure, then recoup that money — plus a set rate of return — from customers over a span of 20 years or more. They can’t start recovering those costs, however, until they go through a rate case, in which state regulators spend nearly a year scrutinizing utilities’ calculations and determining whether their requested rates are justified. Massachusetts requires a new rate case for gas utilities only every 10 years, though the companies can file a request for rate changes more often.
By contrast, the state lets utilities get that money back faster for GSEP projects. Regulators must approve the plans within six months, and then utilities can start passing costs through to customers soon afterward. The law set an initial annual cap on GSEP spending of 1.5% of a company’s revenue, but utility regulators can — and have — increased that number. In 2019, the state raised the cap to 3%.
The costs of the program have climbed from $291 million in GSEP spending in 2015 to a proposed $880 million in 2025. The costs now account for 8% to 11% of customers’ bills.
Have these mounting expenses made the gas system safer? It’s unclear. Utilities argue that replacing pipes is the best way to achieve safer infrastructure. Skeptics of the program, however, say the lure of a quicker payback has encouraged utilities to replace pipes that could have been repaired or relined at much lower cost without any compromises on safety.
“Utilities are frankly getting sloppy on their risk prioritization,” said Jamie Van Nostrand, the policy director at the nonprofit Future of Heat Initiative and former chair of the Massachusetts Department of Public Utilities. “They responded the way you’d expect them to, and that’s to maximize spending on GSEPs. They have a bias in favor of replacement.”
Climate and consumer advocates are also concerned that the state’s decarbonization goals will lead to stranded costs: that customers will still be paying for this decade’s pipe replacements long after the infrastructure has been taken out of service because of state efforts to transition to clean energy and electrified heating.
Utility regulators issued an order in late 2023 outlining principles for transitioning the state off natural gas. Fully replacing pipes might therefore be unnecessary in many cases, as there’s no need to install — and pay for — equipment that will last 50 years when the system may become obsolete in 20 years, said Audrey Schulman, who founded HEET, a nonprofit that advocates for a transition away from natural gas, and is now executive director of climate-solutions incubator Black Swan Lab.
“Although the intent is to keep us safe, the problem is we probably will not be using gas in the same amount in the future,” Schulman said. “Let’s not keep replacing pipes as though we’re going to keep this system going everywhere, forever. It’s an unwise business choice.”
Some changes are underway. A 2022 law created a working group to assess the GSEP program and ensure the guidelines align with the state’s goal of reaching net-zero carbon emissions by 2050. The panel’s final report, released in early 2024, recommends a more rigorous system for prioritizing leaks and stronger rules for considering alternatives to natural gas, such as electrification or geothermal loops.
Last spring, regulators issued a decision lowering the GSEP revenue cap to 2.5% from 3%, a move celebrated by state Attorney General Andrea Campbell as reining in “fundamentally unfair” spending by gas utilities. And utilities should expect this level of scrutiny from regulators to continue, Van Nostrand said.
“We’re going to be taking a much closer look,” he said. “You need to show your work.”
Last May, the Trump administration proposed eliminating a key federal program that lowers energy bills for low-income households. Now, amid a mounting energy-affordability crisis, that program has officially survived — and even gotten a funding boost.
On Tuesday, President Donald Trump signed a spending bill with more than $4 billion for the Low Income Home Energy Assistance Program. Since 1981, the federal initiative has helped millions of Americans pay their utility bills, undertake energy-related home repairs, and make weatherization upgrades that save them money.
Now, LIHEAP has $20 million more than it had last year. The spending line item was part of a roughly $1.2 trillion package to end the partial government shutdown, which passed 217–214 in the House and 71–29 in the Senate.
“LIHEAP provides a lifeline for families who are having trouble paying their utility bills,” said Xavier Boatright, deputy legislative director at the Sierra Club. “For now, we are glad that Congress has acknowledged that letting families suffer without heating or cooling assistance in the face of extreme weather events is truly cruel.”
The move is a stark reversal in the Trump administration’s war on energy efficiency, which last spring threatened to terminate LIHEAP as well as slash other key programs meant to keep household utility bills in check. But energy costs are soaring across the U.S. and have become a pivotal political issue, helping propel Democrats to victory in several state races last November.
Though the funding is enough to assist about 6 million low-income families with their heating and cooling bills this year, it covers only about 17% of eligible households, according to Mark Wolfe, executive director of the National Energy Assistance Directors’ Association.
And despite the new funding — which is comparable to allocations in recent years — the program did take a major hit last April when the Department of Health and Human Services fired the entire team administering LIHEAP.
Still, the program, which provides block grants that states administer, is limping along, according to Wolfe. “They’re leaning on grant-management staff to process state payments and a very small number of senior [staff at the Office of the Administration for Children and Families] to manage policy.”
However, states are missing out on technical assistance, which could hurt LIHEAP’s efficacy long term, Wolfe said.
LIHEAP isn’t the only energy efficiency program to get a reprieve. In January, the president also signed a separate appropriations package extending the life of two other long-standing initiatives.
One is Energy Star, the Environmental Protection Agency program that bequeaths its bright-blue label to consumer appliances that meet certain efficiency standards.
That initiative is now stronger than ever, with $33 million in funding — slightly more than in fiscal year 2024. Last spring, the EPA said it planned to disband or privatize the high-value program, which has helped Americans save $40 billion on their energy bills each year: For every dollar of benefit, the program cost the government less than a tenth of a penny, according to the nonprofit Institute for Market Transformation.
In the same spending bill, Congress also revived the Weatherization Assistance Program, which for the past half century has aided millions of households in making their homes more resilient to extreme temperatures, with upgrades such as insulation and plugging air leaks. These home improvements save families an average of $372 every year.
Before that piece of legislation landed on the president’s desk in January, the Republican-controlled Congress overwhelmingly approved the package, which passed the House 397–28 and the Senate 82–15.
While advocates celebrated the funding of LIHEAP as a crucial move, Boatright pointed out that the broader cost challenges aren’t going anywhere. After all, he said, many Trump administration policies — like blocking cheap, clean energy — will continue to make affordability problems even worse.
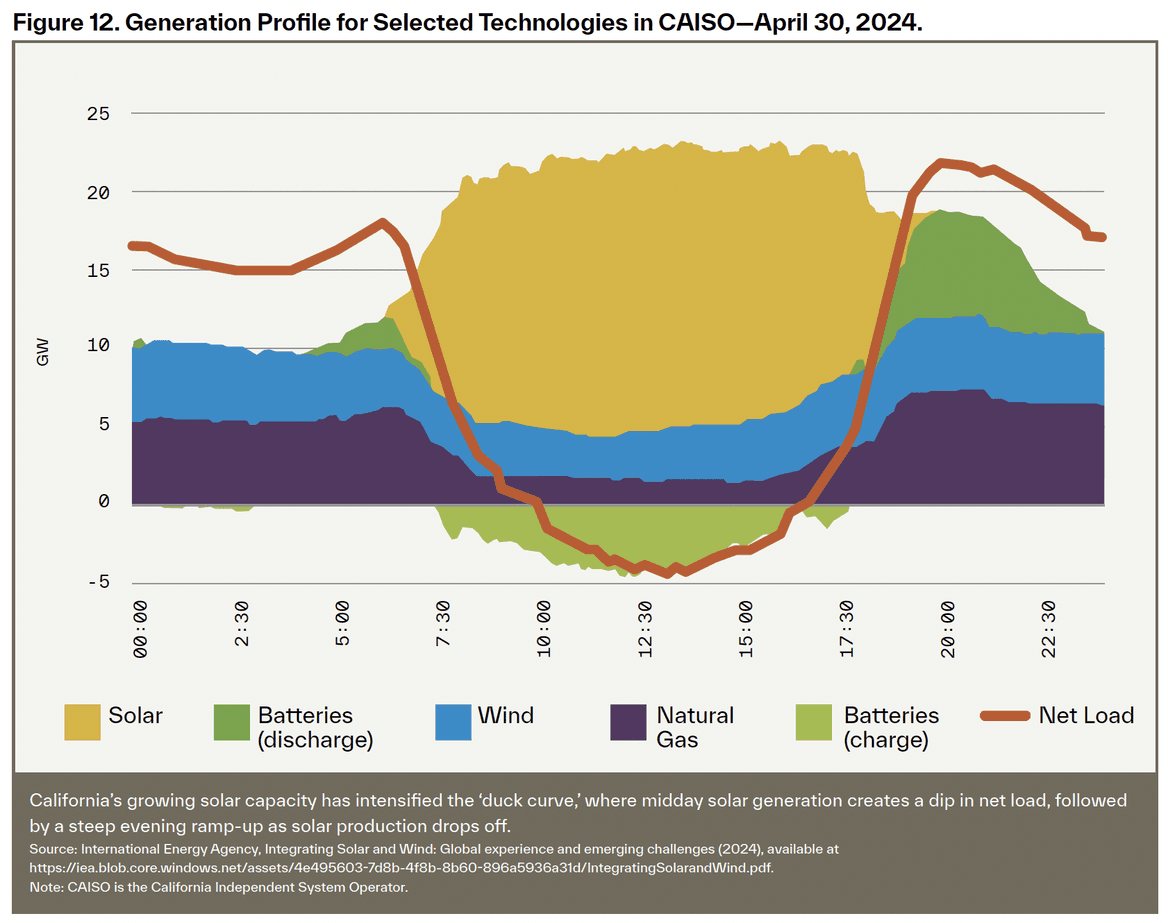
California’s power system has an infamous problem. Solar projects produce more electricity than is needed during the day but too little to satisfy demand at night. So the state’s major utilities are developing new electricity rates to encourage their largest customers to shift to using more power during those hours of sunny abundance.
The undertaking is meant to cut utility bills and curb carbon emissions across the grid. But climate advocates say it also could be a crucial tool for tackling another energy challenge in the state: industrial electrification.
Some 36,000 manufacturing facilities operate in California, and many use large amounts of fossil gas to produce everything from cheese, olive oil, and canned fruit to cardboard, medicines, and plastic resins. Switching to electrified processes would significantly and immediately slash emissions from those factories, experts say. Yet industrial firms are generally hesitant to change — and sky-high power bills are a major reason why.
“It’s been a huge barrier to electrification for manufacturers,” said Teresa Cheng, California director at the decarbonization-advocacy group Industrious Labs.
Industrial customers in California pay over 19 cents per kilowatt-hour for electricity, which is more than twice the national average. They also pay demand charges based on their peak power usage during the month. These costs can represent around 30% or more of a facility’s utility bill — effectively penalizing companies for increasing their electricity use, Cheng said. Meanwhile, industries still pay relatively less for fossil gas.
This dynamic threatens to undermine the state’s broader efforts to get factories off fossil fuels, she added. California’s industrial sector uses one-quarter of all the fossil gas burned in the Golden State, and it contributes over 20% of the state’s annual greenhouse gas emissions, along with health-harming pollution.
In recent years, state lawmakers and regional regulators have adopted policies to push manufacturers to electrify their equipment. Last October, Democratic Gov. Gavin Newsom signed a law, Assembly Bill 1280, that expands incentive programs to help manufacturers install industrial heat pumps, thermal storage systems, and other clean technologies. In Southern California, the air-quality district in 2024 passed a landmark rule that’s expected to drive adoption of electric boilers and water heaters in the smog-choked region.
“There’s a very strong climate policy from the top down that recognizes that industrial decarbonization is a big part of California’s success,” said Anna Johnson, state policy manager at the American Council for an Energy-Efficient Economy.
Still, “there hasn’t yet been a really concerted effort to address the operating costs,” she added. “We want to see a clear path for manufacturers both to replace outdated equipment with more efficient, cleaner, and safer equipment, and then also for them to be able to operate economically afterwards.”
Just this week, though, California state Sen. Josh Becker introduced a bill that aims to tackle that missing piece. Senate Bill 943 proposes making changes to electricity rates to help manufacturers and large commercial companies switch to electricity for industrial heat.
Both Johnson and Cheng contributed to a recent report by the American Council for an Energy-Efficient Economy, Industrious Labs, the Sierra Club, and Synapse Energy Economies that outlines strategies for updating industrial rates to accelerate electrification.
Their analysis is meant to inform California’s three biggest utilities as they devise new rate options for large customers. The concepts, however, could apply to other parts of the country that have plenty of intermittent renewables, like Texas and the Midwest “wind belt,” and regions where industrial electricity is far more expensive than fossil gas, such as the Upper Midwest and Northeast, Johnson said.
California is facing both realities.
Last August, the California Public Utilities Commission instructed Pacific Gas & Electric, Southern California Edison, and San Diego Gas & Electric to design dynamic hourly rates that “align electricity prices more closely with grid conditions to promote efficient energy use.” Simply put, the goal is to make it cheaper for large customers to use power when the grid is overloaded with utility-scale solar, which often gets curtailed.
The three investor-owned utilities are required to start offering customers the option of dynamic pricing by 2027, providing a chance to transform how major electricity users pay for power.
One option is to develop granular, real-time rates that allow customers to respond to hourly price signals, which reflect the fluctuations in wholesale market prices or transmission and distribution costs. It would reward companies that, for instance, install thermal energy storage systems to bank electricity when supplies are ample and cheap, then tap the thermal battery when grid power is more expensive or constrained.
Another approach is critical peak pricing, which charges higher electricity rates during a narrow window of peak demand — but also offers lower rates or gives credits to customers that reduce electricity consumption during grid emergencies, helping prevent blackouts. While companies can’t randomly flip their factories off and on, they typically can shift their production times or scale back for a limited period.
Utilities could also eliminate the “non-coincident demand charges” that industrial customers currently pay. As an example, Cheng said, a tomato-canning facility that uses a maximum of 500 kilowatt-hours during the month is charged the same amount whether the plant reaches that peak at 12:30 p.m. in March — a sunny time of day during a mild time of year, when there’s likely a surplus of power — or at 5:30 p.m. during a heat wave, when the grid is overtaxed.
“The way it’s structured is backwards, because it actually punishes electrification and doesn’t reflect the actual cost causation or grid impact of that energy use,” she said.
Encouraging factories to use more off-peak and renewable power should benefit not only manufacturers but also the grid at large, since it reduces the need for utilities to make expensive infrastructure upgrades or add power capacity — costs that all ratepayers shoulder, said Rose Monahan, a staff attorney with the Sierra Club Environmental Law Program, who also contributed to the report.
“Bringing on more electric load and strategically doing that in a way that doesn’t put a huge strain on the grid, and helps use the resources that we already have, should be a win-win for everybody,” she said.
Solving the formidable challenge of electrifying large, energy-intensive operations will require far more than redesigning utility rates — in California and nationwide. Installing new equipment can incur high up-front costs, and fossil gas remains enticingly inexpensive in many regions. Some of the more promising innovations for high-heat industrial processes, like thermal batteries and heat-pump boilers, are only just now hitting the market, meaning companies may be unaware or uncertain of how the cleaner equipment works.
“The [utility] rates on their own won’t do it, and the technologies on their own won’t do it — it’s the combination,” Johnson said. “Being able to have the two of those together in the same place is where you really start to get that market transformation toward these more efficient electric technologies.”
Silicon Valley–based startup Lunar Energy has spent the last six years building a business for its smart home batteries and the virtual power plant software that can orchestrate those systems to support the grid at large. Now, it has a massive new pot of cash to expand that effort, as utilities and state policymakers look to leverage such technologies to help meet soaring power demand.
On Wednesday, Lunar Energy unveiled $232 million in new funding. The investment is made up of a $102 million Series D round led by B Capital and Prelude Ventures, which closed in recent months, and a previously unannounced Series C financing of $130 million led by Activate Capital in 2024.
Added to the $300 million round Lunar Energy raised in 2022 from investors including U.S. residential solar leader Sunrun and South Korean battery giant SK Group, that brings the total investment to just over half a billion dollars. Lunar Energy CEO Kunal Girotra, who previously led Tesla’s residential energy business, declined to share the startup’s revenues or expectations for profitability. But he did say, “This capital helps us, in a big way, in achieving our goals of not having to raise ever again.”
Much of the new money will go toward expanding Lunar Energy’s manufacturing capacity for its home battery and energy-control hardware, he said. The company produces its equipment in California, Georgia, and Washington state and has installed it in about 2,000 homes and businesses in California. The firm plans to increase its manufacturing capacity from about 10,000 battery systems per year today to 20,000 per year by the end of 2026 and to 100,000 per year by the end of 2028, Girotra said.
Home batteries are a competitive market, with Enphase, FranklinWH, Generac, LG, SolarEdge, Sonnen, market leader Tesla, and other companies all vying for customers. Lunar Energy’s systems are priced on the higher end of the spectrum, with typical installation costs coming in at about a 10% premium to Tesla’s Powerwall batteries, Girotra said.
But Lunar Energy’s system comes with a bunch of integrated hardware that differentiates it from many other home batteries, Girotra said. It includes modular batteries that can provide 15 kilowatt-hours to 30 kilowatt-hours of storage, allowing consumers to build a system that is rightsized for their homes. Lunar Energy also incorporates inverters and optimizers to efficiently convert power from rooftop solar panels into stored electricity. And its digitally controllable circuit breakers mean that homeowners can use a smartphone app to control which household circuits solar and battery power flow to; this can be useful for emergency backup or to save on utility bills on a daily basis.
“With the other companies, you have to add other components to them to get an apples-to-apples comparison,” Girotra said. “And we’ll be closing the [price] gap with Tesla very soon.”
Then there’s Lunar Energy’s virtual power plant software, which allows the company to control home batteries, EV chargers, and other power-using appliances. The VPP technology essentially lets these distributed energy resources act in tandem to function like a traditional power plant.
The company first began its foray into VPPs in 2022, when it acquired the U.K.-based startup Moixa, which managed batteries, smart thermostats, and other controllable devices in Japan and the U.K. That software now controls close to 150,000 devices in homes, including those of Sunrun customers participating in VPP programs in California, Hawaii, New England, and Puerto Rico, Girotra said.
Lunar Energy plans to also expand its VPP services this year, Girotra said, partnering with several of California’s community choice aggregators and retail electricity providers working in competitive markets. By year’s end, the company expects to have customers in several more states, such as Texas, which has become a major target for VPPs from major energy retailers, smart-thermostat providers, solar-battery installers, and manufacturers of stand-alone backup batteries.
Clean energy advocates and experts expect that VPPs are the path to making rooftop solar and battery systems successful in the Trump era, as rooftop solar alone becomes an increasingly tough proposition in many markets.
The megalaw passed by Republicans in Congress last year ended decades-old tax credits for homeowners installing clean energy systems, tamping down growth expectations for the rooftop solar industry, although third-party installers can still use tax credits for some time. Meanwhile, California’s 2023 cuts to rooftop solar incentives have led to a steep drop-off in installations in the country’s leading market.
But pairing solar with batteries boosts homeowners’ energy bill savings — a significant motivator for consumers as utility rates spike across much of the country, including in California.
Many states are looking to use VPPs to avoid investing in costly traditional power plants to meet skyrocketing power demand — a surge driven by data centers, factories, and the rapid electrification of buildings and vehicles. VPPs provided hundreds of megawatts of grid relief last summer in California, Puerto Rico, and New England, and states including Colorado, Illinois, Maryland, Minnesota, North Carolina, Utah, and Virginia have passed laws or are pursuing regulatory action to expand their use.
Lunar Energy isn’t the only company raising money on the prospects of VPPs. Texas-based startup Base Power raised $1 billion last year to ramp up manufacturing capacity for batteries it installs at low or no cost in homes and businesses. The company then leverages these systems into a VPP that it can use to earn a profit in the Lone Star State’s competitive energy markets.
And San Francisco–based startup Span — which makes smart electrical panels that let homeowners, businesses, and utilities digitally control power flows between solar installations, batteries, EV chargers, and other building loads — is in the midst of raising a $176 million investment round.
Data from the subset of Lunar Energy systems in VPPs under its own control shows that customers earn an average of $464 per year by participating in those programs. That’s on top of the $338 that Lunar Energy customers save on average each year by fine-tuning their home energy systems to consume grid power when it’s at its cheapest and most plentiful.
“We see behind-the-meter storage with software as a key element for solving the power-demand problem,” Girotra said. “If you give people more of these devices and you let them control them, you suddenly have a grid that doesn’t have to build the 5x — or 5,000x — capacity that we’re asking for in a short amount of time.”
The Trump administration is facing lawsuits from states and environmental groups opposing its use of emergency power to force aging coal plants to stay online. Now, add utilities to its list of challengers.
Last week, the cooperative utilities Tri-State Generation and Transmission Association and Platte River Power Authority filed a petition asking the Department of Energy to reconsider its December order demanding that they keep running Craig Generating Station’s Unit 1, a jointly owned coal plant in Colorado, for the next 90 days.
Tri-State and Platte River — along with co-owners Salt River Project, PacifiCorp, and Xcel Energy — have been preparing to close the plant since 2016, both to comply with Colorado’s plan to shutter all coal generation by 2030 and to replace an aging and increasingly expensive source of power. Forcing them to operate it past December will require their members to bear unnecessary costs, which constitutes an “uncompensated taking” of their property in violation of the Constitution, the petition argues.
Tri-State and Platte River operate as nonprofit co-ops, which are owned by the customers they serve, meaning that they cannot pass the cost of keeping a plant open along to a multistate regional transmission network, as for-profit utilities can. Instead, their member-customers need to absorb the entire blow.
The consultancy Grid Strategies has estimated that keeping Craig Unit 1 running for 90 days would cost at least $20 million, and that running it for a year could add up to $85 million to $150 million. The utilities operating Craig Unit 1 have already had to take on the costs of repairing a valve failure that forced the plant offline in December.
It will also disrupt the use of long-planned replacement resources that can provide power more cheaply and reliably than Craig Unit 1 — including the 145-megawatt Axial Basin solar farm, which may be forced to curtail its electricity generation because of grid congestion due to keeping the coal plant online.
“We do not take this request for a rehearing lightly,” Tri-State CEO Duane Highley said in a Thursday press release. “But as not-for-profit entities, we face issues that other utilities do not, because it is our members that ultimately are going to pay for the cost of this order.”
The petition from Tri-State and Platte River marks the first time a utility has publicly contested a Trump administration must-run order, said Michael Lenoff, a senior attorney at Earthjustice, a nonprofit law firm that’s filed challenges and lawsuits against similar orders across the country.
“DOE should listen to utilities on the ground making sure the lights stay on, and not advance its policy to rescue the dying coal industry and force other people — in other words, ratepayers — to pay for it,” he said.
Since last year, the DOE has used its authority under Section 202(c) of the Federal Power Act to require a Michigan coal plant and an oil- and gas-fired plant in Pennsylvania to stay open for three consecutive 90-day periods. In December, in addition to Craig Unit 1, it issued similar orders for two coal plants in Indiana and one in Washington state.
The DOE has justified the orders by claiming that the power grid faces an imminent, increasing threat of major blackouts. But energy experts refute the idea that such a grid crisis is around the corner, arguing that the Trump administration is relying on a false premise. The true goal, they say, is to misuse emergency authority to benefit the coal industry by forcing customers to continue to pay for power plants that can’t compete economically against much cheaper power from renewables, batteries, and fossil gas.
State attorneys general and environmental groups have filed rehearing requests with the DOE on all of these must-run orders. To date, the DOE has declined to take up those administrative challenges, opening the pathway for challengers to file lawsuits.
In December, a coalition of environmental groups filed a legal brief with the U.S. Court of Appeals for the D.C. Circuit challenging DOE’s first Section 202(c) order, for the J.H. Campbell coal plant in Michigan. It asked the court to “put an end to the Department’s continued abuse of its authority, which has imposed millions of dollars in unnecessary costs and pollution on residents of Michigan and the Midwest.”
Indeed, the moves are pushing substantial costs on to utility customers at a time when electricity bills are already rising far faster than inflation. The Sierra Club, which is tracking the costs of keeping coal plants running under DOE emergency orders, estimates the price at just over $202 million as of Monday, up from more than $158 million as of the second week in January.
If the DOE forces the continued operations of every fossil-fueled power plant scheduled to retire between now and the end of 2028, the costs could add up to $4.8 billion, according to a 2025 study by Grid Strategies. Extending the analysis to also include every power plant that is 60 years old or more could increase the cost to nearly $6 billion, the study found.
These costs come in the form of retaining workers, securing new coal supplies, and undertaking maintenance and repairs that were once deferred. And they’re not the only expenses associated with the orders: Utility customers must also pay for the resources that utilities have already secured to replace the closing coal plants.
All these costs will add up if Craig Unit 1 is forced to stay online. “We have planned for the retirement of this resource for over a decade and have proactively replaced the capacity and energy from new sources,” Jason Frisbie, general manager and CEO of Platte River, said in the press release.
In other words, as Matthew Gerhart, senior attorney at the Sierra Club, previously put it to Canary Media, the Trump administration’s actions mean that customers will “end up paying twice.”
This article originally appeared on Inside Climate News, a nonprofit, nonpartisan news organization that covers climate, energy, and the environment. Sign up for their newsletter here.
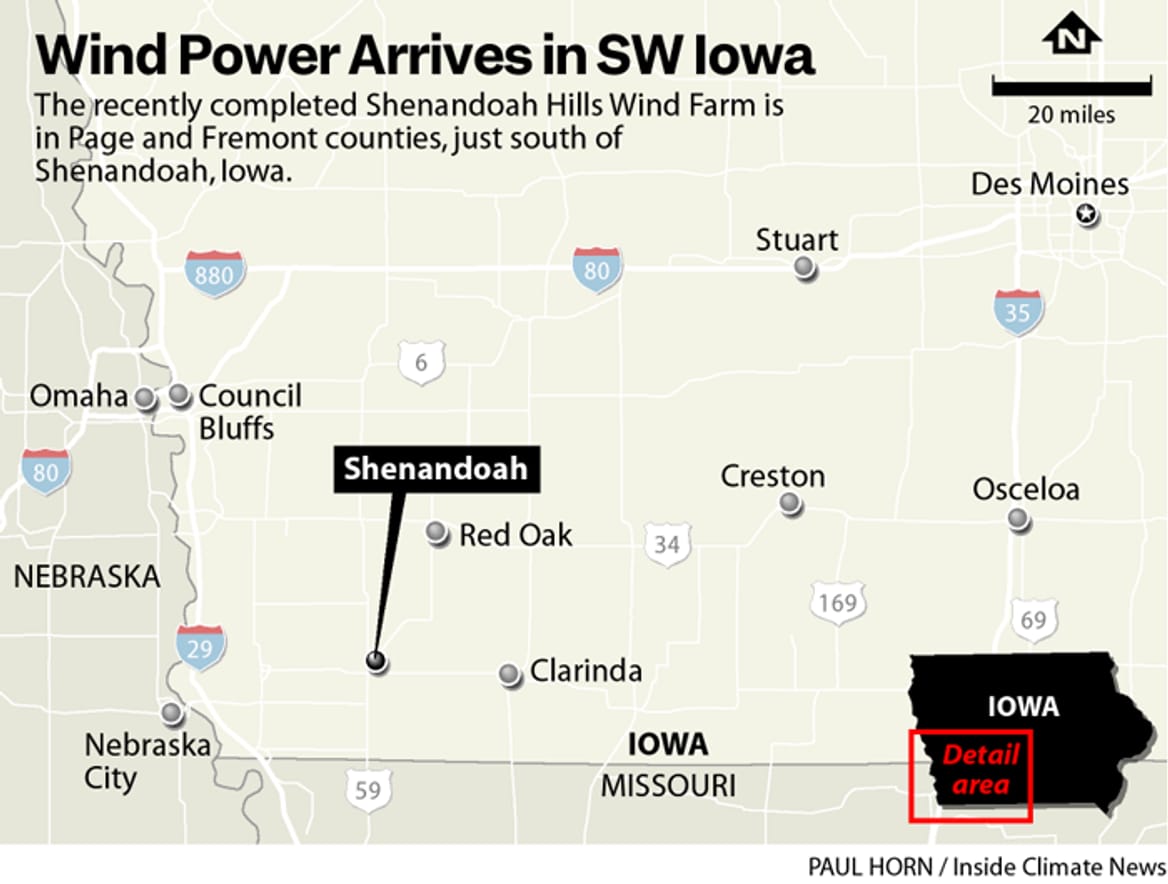
SHENANDOAH, Iowa — First viewed from a pickup truck driving south on U.S. 59, the wind turbines seem small and delicate.
The newly constructed wind farm is a matter of pride for Gregg Connell, the man behind the wheel of the truck. He is a former two-term mayor of this southwestern Iowa city and an official with the local chamber of commerce.
The turbines are “beautiful,” Connell said, looking out the driver’s-side window. “You’re capturing energy, you’re helping the environment.”
But the sight of a new wind farm is increasingly rare, even in Iowa, a state that trails only Texas in electricity production from wind.
Wind energy development has all but ground to a halt in the face of community opposition, a phaseout of federal tax credits, and the Trump administration’s actions to slow the approval of federal permits.
Some of the administration’s most notable moves on wind power have been attacks on offshore development, including a stop-work order in December that halted construction on five projects. But land-based wind projects — often described in the industry as “onshore wind” — are a much larger contributor to the nation’s electricity supply and are struggling to make even modest gains. Without robust growth in onshore wind, the United States will be severely limited in its ability to build enough power-generation capacity to meet rising demand and combat climate change.
One of Iowa’s few new developments, the Shenandoah Hills wind farm, illustrates what it takes to build in the current political and regulatory environment.
The developer, Chicago-based Invenergy, faced years of blowback from residents who raised concerns about damage to the visual landscape along with concerns about potential harm to human and animal health and effects on property values. The opposition campaign dragged on into court cases and led to one county supervisor losing his reelection bid.
Though controversial, Shenandoah Hills still had the advantage of obtaining all its federal permits before the Trump administration returned to office in January and began using federal agencies to slow or halt new projects.
If the Shenandoah Hills ordeal is what success looks like for the wind industry, then it’s understandable that investors, developers, and others see few reasons to pursue new projects.
“U.S. onshore wind is in its weakest shape in about a decade, not because the technology has stopped being competitive, but because the policy and, to an extent, the macro-environment have turned sharply against it,” Atin Jain, an energy analyst for the research firm BloombergNEF, said in an email.
In 2024, the most recent full year for which data is available, wind energy produced 7.7 percent of the nation’s electricity, more than any other renewable source, according to the Energy Information Administration. Since the country has only three operational offshore wind farms, onshore wind accounts for nearly all this production.
New projects peaked in 2020, when 14,878 megawatts of onshore wind farms came online in the United States, according to the EIA. This number has decreased steadily since then, bottoming out at 5,026 megawatts in 2024.
The industry had a slight rebound in 2025, with 7,804 new megawatts of capacity — including completed projects and those that were projected to be operational by Dec. 31 — and will grow more in 2026, with 10,044 megawatts listed by EIA as planned for completion.
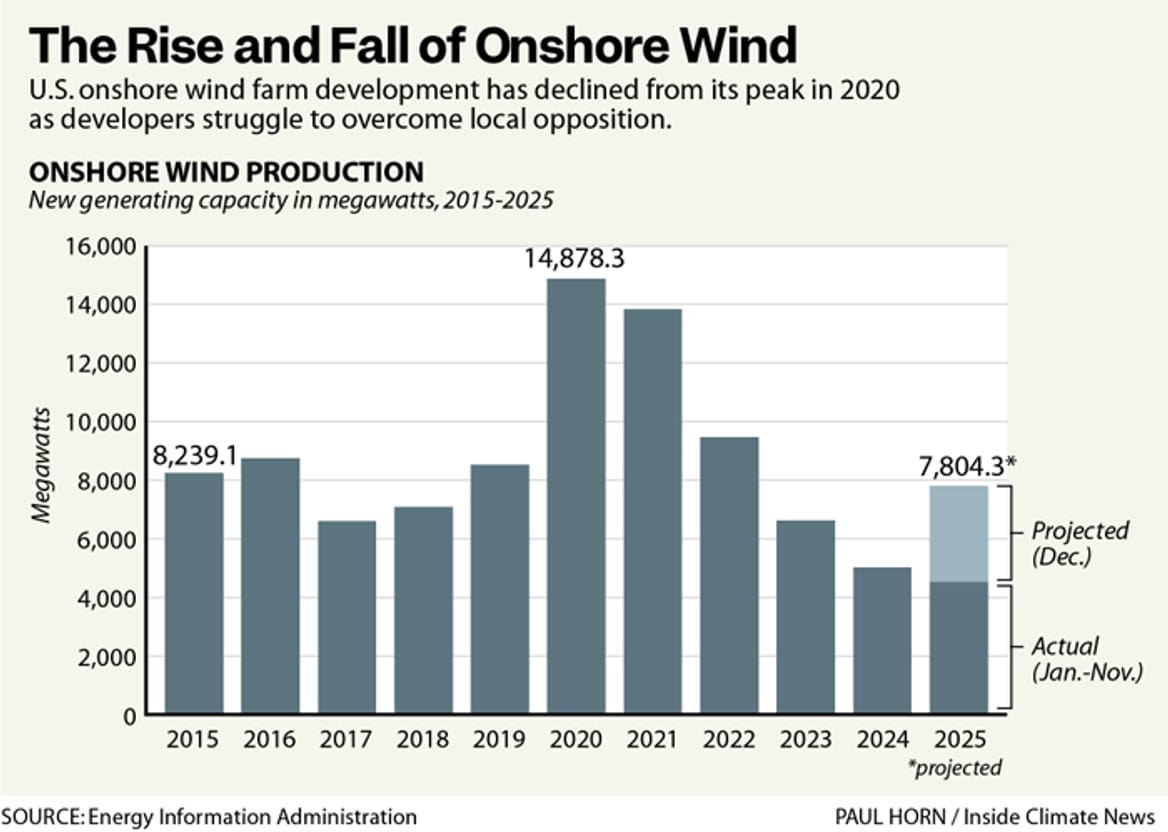
After that, things are likely to get much worse. Developers and analysts expect a drop-off in 2027 and beyond, when the current chill in development stemming from the Trump administration’s actions will lead to fewer completed projects.
Meanwhile, electricity demand is soaring as utilities and grid operators determine how to meet the needs of large users such as AI data centers.
There is a disconnect in the market when demand is surging while wind power development is slowing, a situation that bodes poorly for the future of clean energy in the U.S., said Michael Thomas, CEO of Cleanview, a market intelligence platform focused on power plants and data centers.
“The decline in wind energy development is one of the trends that I’m most concerned about when it comes to climate progress in the United States,” Thomas said in an email. “I’m not aware of a single model that shows us meeting our climate targets or avoiding significant warming without a huge buildout out of wind power.”
Connell, 76, parked his truck on the gravel lot that the wind farm’s construction crew has used as a staging ground for the past year. Workers installed the last of 54 turbines in November, bringing the total generating capacity to 214 megawatts.
Acting as a tour guide for two reporters, Connell had spent much of the day discussing his work as mayor and now as executive vice president of the chamber of commerce to attract jobs and investment to Shenandoah.
A city of about 4,900 residents, Shenandoah was the childhood home of the Everly Brothers, the musical duo behind hits such as “Wake Up Little Susie.” The main street has a vitality that many other cities of this size would envy, with a first-run movie theater and a recently renovated mill that now hosts an indoor farmers market.
Still, such vibrance is a challenge to maintain.
The median age in Page County, which includes much of Shenandoah, is 45 years, the 12th highest of Iowa’s 99 counties. To grow and prosper, the community needs to attract new residents, and to do so, it needs to maintain and expand a tax base that can support schools and government services.
“We need more young people,” Connell said.
The Shenandoah Hills wind farm is one of the largest investments in the county’s history. Payments to landowners and local governments are projected to total $234 million over the life of the project, according to Invenergy.
For context, the Shenandoah school district has an annual budget of $28.4 million, with $6.2 million from local property taxes. The wind farm is expected to generate an additional $1.3 million in property taxes annually for the district, based on a 2022 estimate from a consulting firm on behalf of Invenergy.
Invenergy’s plans for a wind farm in the area had been underway since the mid-2010s. The company already had the support of landowners willing to lease their property and of government officials who were moving forward with permit approval.
Then, in the late 2010s, something changed. In both Iowa and nationwide, wind energy projects began to face local opposition that was more aggressive and better organized than before.
Some of the shift was due to the boom in wind energy, which had already changed the landscape in parts of Iowa, contributing to backlash from residents who disliked the look of the turbines.
Some of the changing tide was partisan, fueled by the hardening of beliefs that Democrats support renewable energy and Republicans — the large majority in rural Iowa — support fossil fuels. President Donald Trump helped popularize this view with his use of the unfounded term “wind cancer” and other criticism of wind and solar energy.
The upshot was that the development of Shenandoah Hills turned bitter.
The opposition organized on social media, including a Facebook group, Page County Horizons, which served as a forum to encourage attendance at public meetings and to share video clips and articles portraying wind energy as dangerous and unreliable.
Todd Maher, who lives within view of the wind farm, opposed the project and decided in 2022 to run for the county Board of Supervisors because he felt that officials weren’t listening to concerns. He won in the Republican primary, defeating the incumbent, who supported the wind farm, and then ran unopposed in the general election.
“A lot of people want to live where they can see the sunrise and sunset without having to look at a wind turbine,” he said in a recent interview.
Maher, 55, lives on an acreage with a donkey, chickens, cats, and dogs. He has worked for most of his adult life at the Pella Corp. window plant in Shenandoah.
One of his main concerns with the wind farm was the disconnect he observed between the landowners who would receive lease payments and residents who would actually see the turbines every day. Most of the owners don’t live near the turbines, and many of them don’t live in the county or the state, he said.
This isn’t unusual, with the heirs of farmers and investment companies owning a large share of U.S. farmland. But it’s frustrating, said Maher, that people who live in the area will have their views spoiled while somebody else is paid for the leases.
Once Maher took office, he found it wasn’t easy to stop the project. The board passed a moratorium on wind energy development that was to include Shenandoah Hills. Invenergy responded by suing the county, arguing that the sudden change should require taxpayers to reimburse the company for the money it had already spent.
Legal counsel warned county officials that there was a decent chance of losing in court and then facing a judgment so large that the government might need to file for bankruptcy.
Maher was unwilling to take that risk. In November 2024, he was in the majority in a 2–1 vote to accept a settlement with Invenergy that would allow the project to move forward.
“It was the toughest vote I’ve ever made,” he said. “I lost a lot of friends over it. I lost a lot of people that supported me.”
Iowa, especially its western half, has some of the richest wind resources in the country.
Early developers capitalized on this, with the completion of Storm Lake 1 in northwestern Iowa in 1999, the first wind farm in the state, with a capacity exceeding 100 megawatts. By 2010, wind farms were a familiar part of the landscape, with more than 3,500 megawatts of capacity, including some large installations along Interstate 80, the major east–west highway that bisects the state, connecting California to New Jersey.
For years, Iowa’s leadership in wind energy was a point of pride, with the silhouette of a wind turbine appearing on the state’s license plate next to images of city skylines and farm buildings.
Wind power enjoyed bipartisan support in the state, with proponents including Democrats such as former U.S. Sen. Tom Harkin and former Gov. Tom Vilsack and Republicans such as former Gov. Terry Branstad and U.S. Sen. Chuck Grassley. They viewed wind farms as an opportunity to increase incomes in rural counties.
Their vision paid off. As of 2024, Iowa led the country in the share of electricity produced by wind farms, with 63 percent.
But the era of growth in Iowa’s wind industry is almost certainly nearing its end. Shenandoah Hills was one of just three wind farms to be completed in the state in 2025, and only one was completed in 2024, according to the EIA. The last significant year of development was 2020, when 12 projects went online.
The contraction of the industry is a grave concern for Jeff Danielson, a Democrat who served four terms in the Iowa Senate and now is vice president of advocacy for Clean Grid Alliance, a clean energy business group.
“Iowa is essentially closed for business when it comes to wind development,” he said.
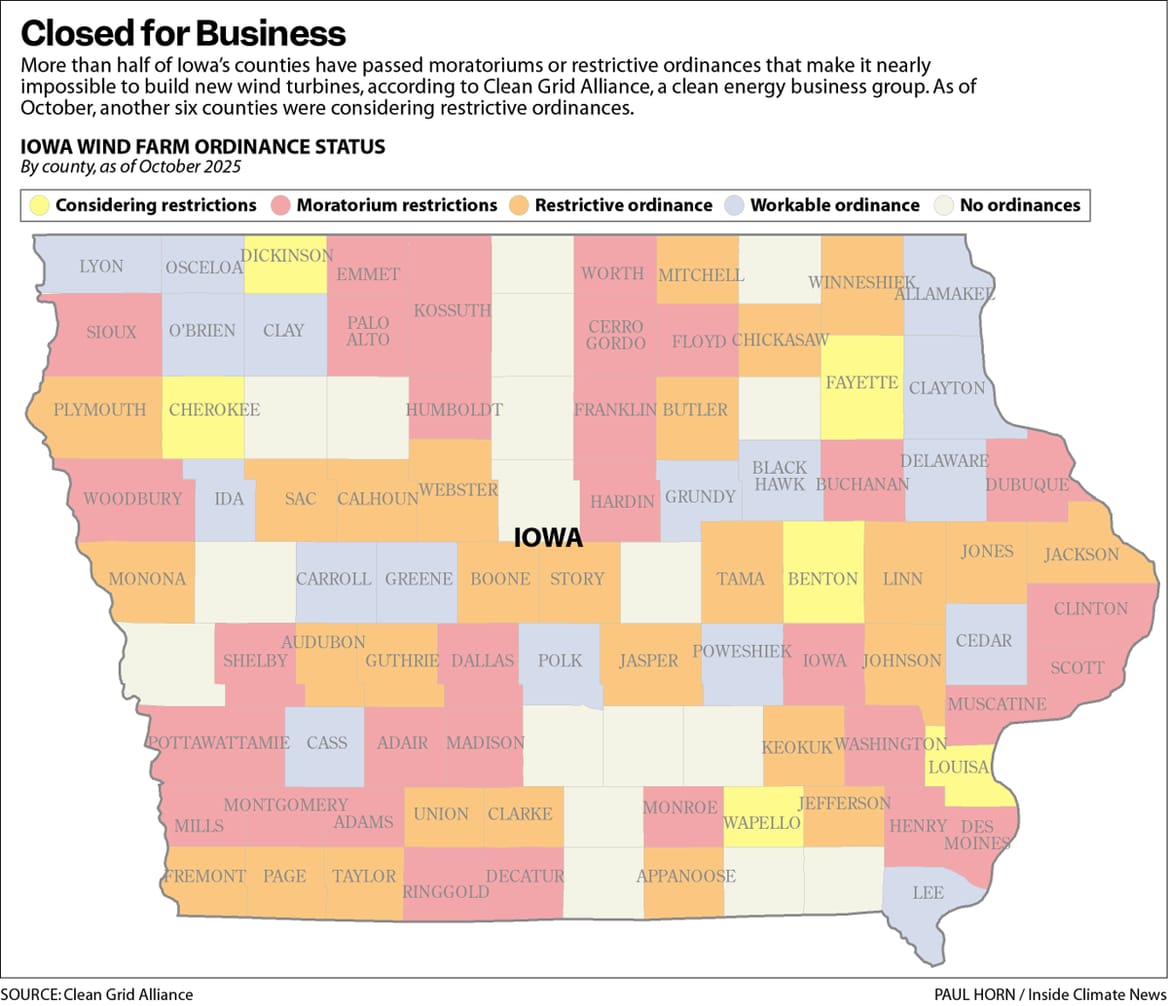
The resistance comes almost entirely from the local level. His organization lists 58 of Iowa’s 99 counties as having rules designed to limit wind power development, including many of the counties with the strongest wind resources.
He described the opposition as formidable in its ability to organize at the local level and then throw out a large number of objections in the hope that one of them will stick. It’s not a fair fight, with one side repeating a litany of claims found on anti-wind websites, and the wind power companies obligated to stick to facts that will stand up in court, said Danielson.
“It’s not even really an adult conversation anymore,” he said.
If Iowa’s legislature and governor wanted to encourage wind energy development, they could pass a law to expand state authority to approve projects, limiting the ability of local governments to pass restrictions. The state has previously done this on hot-button issues such as regulating large animal-feeding operations, but there’s little indication they’ll intervene when it comes to wind.
“One thing you find out about legislators is they like local control when they like it, and they don’t always like it,” said Iowa Rep. Brent Siegrist, a Republican whose district is a short drive from Shenandoah.
Siegrist supports wind energy and thinks it is important for making Iowa an attractive location for providing plentiful, affordable electricity for data centers. But he doesn’t expect any push at the state level to make it easier to build wind farms. Republicans control both chambers of the legislature and the governor’s office.
“I’m not sure that we would step into that,” he said.
If Iowa isn’t building much wind power, it’s a bad sign for the industry as a whole.
But local opposition in rural areas is just one of several obstacles for wind developers.
The passage of the One Big Beautiful Bill Act in July included a rapid phaseout of the production tax credit, an important federal policy that had helped encourage development.
Developers are now on a tight deadline. Projects must be completed by the end of 2027 or begin construction by July 4, 2026, to qualify for the tax credit.
Amid the rush to begin construction, the Trump administration has issued executive orders to slow development of wind and solar. Interior Secretary Doug Burgum has taken additional steps, requiring that he personally sign off on new wind or solar projects subject to his agency’s jurisdiction.
Jain, the BloombergNEF analyst, said the global wind energy market faces challenges tied to local acceptance and slow progress in building enough power lines to serve new projects.
The United States deals with those same problems, as well as the obstacles created by its federal policies.
The U.S. outlook, Jain said, “now looks so much weaker than the global picture.”
In Shenandoah, the wind farm is up and running, but the debate over its approval has left scars.
In February 2025, Invenergy sold the project to MidAmerican Energy, Iowa’s largest electricity utility. Invenergy quietly walked away from the wind farm while MidAmerican inherited a community relations crisis.
MidAmerican has attempted to smooth things over, hosting events for landowners and community members and meeting with supervisors and engineers of Page and Fremont counties.
Outside the two counties, MidAmerican’s publicity for the wind farm has been scant. However, in recent correspondence with Inside Climate News, the company expressed no regrets over its decision to take on the project.
“The Shenandoah Hills wind farm is an economic success story for both Page and Fremont counties,” Geoff Greenwood, media relations manager for MidAmerican, wrote in an email. The company projects paying nearly $87 million to Fremont County and $65 million to Page County in property taxes over the life of the project, said Greenwood.
“Wind energy has helped us create relationships with partner landowners and helps Iowa attract new companies to the state. It also provides direct, long-term economic benefits to our rural areas,” Greenwood added.
But as the very last turbines were erected outside Shenandoah, the atmosphere hardly felt triumphant.
The closest thing to a celebration was a ribbon-cutting held in September 2024 when Invenergy opened an office in downtown Shenandoah to manage the construction and community relations.
Connell, who has been unabashed in his support for the project since the beginning, was one of the people holding the ribbon. But his words that day didn’t feel like a victory lap.
“This has been a difficult project,” he said, quoted by KMA, the local radio station. “There are people that oppose wind, and there are people for wind. But I admire the fact that Invenergy, in my estimation, has taken the high ground on everything.”
The office closed a few months later, around the time of the sale to MidAmerican.
Maher, the county supervisor, wishes the wind farm had never happened. But since it’s here, he is hopeful that he and his neighbors can learn to live with the change.
“Maybe things will not be as bad [as we fear, and] we can find a good common ground to where we can coexist.”
A group of governments in the Denver metropolitan area has managed to hold on to a nearly $200 million federal grant to unleash heat pumps in the region — and now it’s putting that money to work.
The group has retained the funding, awarded by the Environmental Protection Agency in 2024, even as the Trump administration has canceled or attempted to claw back tens of billions in grants and loans doled out under Biden’s landmark climate and energy laws: the Inflation Reduction Act and the Infrastructure Investment and Jobs Act.
The Denver Regional Council of Governments, whose members include area cities, towns, and counties, launched the new Power Ahead Colorado initiative last week. The program aims to improve local air quality and public health by tackling pollution from the region’s biggest emitters: buildings. Fossil fuel–powered appliances release toxic compounds, both indoors and outdoors, that increase the risk of a wide range of maladies, including asthma and cancer.
Power Ahead Colorado will provide free energy-efficiency and heat-pump retrofits to about 2,000 low-income households, offer personalized help from on-call energy advisers, issue $40 million in rebates for home energy upgrades, and train an estimated 4,800 heat-pump installers.
Eradicating gas usage is essential for Colorado to decarbonize its economy by 2050. About seven out of 10 households in the state burn gas as their primary source for heating.
“Everybody across the region stands to benefit from cleaner air, and Power Ahead Colorado … is specifically designed to do that,” said Chris Selk, communications and engagement program manager of Power Ahead Colorado.
Installing a heat pump to heat and cool spaces, a heat-pump water heater, and other electric appliances that eschew fossil fuels “has such an incredible impact on your comfort, your safety, and your health,” Selk added.
This flash of good news comes during a murky time for clean energy and decarbonization.
The Trump administration and Republican-controlled Congress have canceled or unlawfully terminated more than $113 billion in emissions-reducing program funding committed under the Biden administration, according to Jillian Blanchard, vice president of climate change and environmental justice at Lawyers for Good Government, a nonprofit that has been advising affected organizations and communities on how to address frozen funds.
The sheer number of federal attempts to rescind project funding — and court decisions ordering their release — has been dizzying.
Take one of the biggest buckets of grant money: the $27 billion Greenhouse Gas Reduction Fund, which included the National Clean Investment Fund ($14 billion), the Solar for All program ($7 billion), and the Clean Communities Investment Accelerator ($6 billion). Grant recipients are fighting for their awards in multiple ongoing lawsuits related to each one of these programs, according to Blanchard. There are four cases about Solar for All funding alone.
But some smaller programs have attracted less attention, including the $5 billion Climate Pollution Reduction Grants program — the source of funding for Power Ahead Colorado. The EPA selected state, local, tribal, and U.S. territory recipients in 2024, and, to Blanchard’s knowledge, all have continued to receive funding, though the reasons are unclear.
Power Ahead Colorado had a brief period last January when it was “unable to draw down any funds,” Selk said. “But that, thankfully, cleared up, and we haven’t had any issues at all.”
Selk estimates that the heat-pump program, which gets reimbursed for its spending, has used roughly 8% to 10% of its grant since 2024. But she expects outlays to pick up speed now that the program has launched. The federal grant lasts until October 2029.
Colorado is investing millions more of federal dollars in decarbonization efforts, the state publicized last week.
With a grant from the U.S. Department of Energy’s Training for Residential Energy Contractors program, the state energy office announced $1 million to teach about 400 heating, ventilation, and air conditioning technicians how to install heat pumps.
The state has also awarded $21.6 million, out of its own $50 million Climate Pollution Reduction Grant, to local governments to foster resilience and lower energy costs through emissions-slashing initiatives, including adopting all-electric building codes and making it easier to develop large-scale solar, wind, and geothermal projects.
The federal government may be throwing up roadblocks to local climate action, but Colorado is demonstrating that the Trump administration hasn’t completely choked political will for ditching fossil fuels.
“People are going to continue to do climate projects at the state and local level,” said Blanchard of Lawyers for Good Government. “And whenever we can leverage federal funding, we will.”
This story was originally published by Grist. Sign up for Grist’s weekly newsletter here.
The ostensibly barren Mojave Desert is in fact teeming with plants and animals, including a rare species known as the threecorner milkvetch. It’s a member of the pea family, splaying across the ground instead of climbing up a garden trellis. Given the harsh desert conditions, it waits until the arrival of rains to burst from the earth — flowering, fruiting, and reproducing.
Though hardy, the threecorner milkvetch — which is under consideration for listing under the Endangered Species Act — and its fellow species in the Mojave are still sensitive to disturbance, like when solar farms literally break ground. Traditionally, energy companies “blade and grade” habitats, meaning they cut out vegetation and even out the soil, which disrupts the seed banks stored within the ground.
In the desert outside Las Vegas, the Gemini Solar Project took a gentler approach, instead trying to preserve the ecosystem. According to a new study, that paid off for the threecorner milkvetch: Before the development, scientists found 12 plants on the site; afterward, in 2024, they found 93, signifying that the seeds survived construction. Compared with those at a nearby plot of land, the plants at Gemini grew wider and taller, and produced more flowers and fruits. That might be because the solar panels shade the soil, slowing evaporation, which makes more water available to the plants to grow big and strong. “So you just have the potential for a lot more plants,” said Tiffany Pereira, an ecologist at the Desert Research Institute and lead author of the paper, which was published late last year. “There’s seedlings of so many other species coming up as well. And so the fact that seed bank survived is phenomenal.”
It’s yet more evidence that solar farms can be built in ways that minimize disturbances to ecosystems. (The company behind the Gemini project, Primergy, did not respond to requests for comment.) This technique is called ecovoltaics: Instead of blade-and-grade, facilities are built with native species in mind. To give the ecosystem a boost, for instance, a crew can seed the soils with native grasses and flowers. “Some of those seed mixes do quite well at solar facilities, and they attract pollinators, birds, and other wildlife as a result,” said Lee Walston, an ecologist at Argonne National Laboratory who wasn’t involved in the new paper. “Sort of asking that umbrella, ‘Field of Dreams’ question, right: If you build it, will they come?”
In Minnesota, at least, the answer is yes. Walston led a study of two solar sites on converted cropland there, observing the growth of biodiversity over the course of five years. The researchers found that the number of unique flowering plant species increased sevenfold, and the abundance of insect pollinators tripled. Native bees alone increased by 20 times. In a follow-on study across a dozen solar sites, grassland birds flocked to the areas, likely attracted by the abundance of insects — same goes for bats. Birds could also nest among the panels, hiding from predators. “We’ve seen positive outcomes, sort of across the board,” Walston said. “Anytime that you’re seeing increases in insect prey, you’ve got at least a really strong potential for also seeing greater bird activity and bat activity, as they are attracted to those sites.”
Such a significant boost to biodiversity is not a given, though. Certain plant species will need more or less shade from the panels: In the Mojave, Pereira found only one threecorner milkvetch, for example, growing directly under a panel. The rest were popping up in the sunnier spaces between them. Young plants of other species, by contrast, might prefer shadier spots, because too much sunlight can stress them.
Panel height is a major factor, too: Taller ones let bigger plant species grow to their full potential — but the higher the supports, the more a solar company must spend on materials. A facility might also set a specific height to accommodate livestock like sheep and goats, used for “conservation grazing” to clear out invasive weeds, which in turn reduces the fire risk of dead plants. “We’re trying to work with developers,” Walston said, “to say, ‘OK, well, if all you can do is 2 feet, what might be the best mix of seed mixes and management styles that could really optimize the habitat?’”
That mowing might sound destructive, but it mimics the natural order of things, as grazers like deer and buffalo, in addition to wildfires, have historically served the same purpose. Ecovoltaics can also return former agricultural fields to more of their natural state. “I think there is real potential for solar farms to be especially good for biodiversity in prairie ecosystems, since prairies evolved over time to require repeated disturbance,” said Johanna Neumann, senior director of the Campaign for 100% Renewable Energy at the nonprofit Environment America, who wasn’t involved in the new research.
The blade-and-grade alternative, on the other hand, doesn’t just disrupt a habitat. With native plant species cleared out, the earth loses the root structures that keep soils from blowing away. Then, opportunistic and fast-growing invasive species can take over, muscling out the natives. And their flowers might not be as enticing for indigenous pollinators, like bumblebees.
Just as endemic plants can grow among solar panels, so too can crops, a technique known as agrivoltaics. Researchers are finding, for example, that things like cucumbers grow like crazy on rooftops. The panels create a unique microclimate that keeps crops from getting too hot in the summer and too cold in the winter, and uses about one-third of the water compared with growing in full sun. Now, scientists are trying to figure out which crops — especially high-value ones that can make up the cost of installing solar — will do the best growing under panels, both on rooftops and on the ground. “If you’re going to grow something, you want to grow something that a potential farmer could sell for decent profit,” said horticulturist Jennifer Bousselot, who studies rooftop agrivoltaics at Colorado State University but wasn’t involved in the new paper. “You name the crop, and there’s interest.”
All told, ecovoltaics and agrivoltaics have the potential to bolster biodiversity and the food supply while generating clean electricity. “Rather than a moonscape of invasive species and dust blowing into cities, why not strive for something better?” Pereira said. “It’s a wild and beautiful place that we live in, and it’s our job to look out for these species as well.”
In December, the Trump administration issued a sweeping stop-work order to every single offshore wind installation underway in America. But, as of today, all five projects have either resumed construction or received the green light from judges to do so.
A federal judge ruled Monday that the 924-megawatt Sunrise Wind project, located off the coast of New York, can resume construction. The wind farm is nearly halfway complete and, before the stop-work order, was expected to begin producing electricity this year.
Ørsted said in a statement that it will “restart impacted activities immediately.”
The December order had cited ambiguous national security concerns in halting construction of Sunrise Wind and the other offshore wind farms. But Judge Royce Lamberth of the U.S. District Court for the District of Columbia found this justification insufficient after reviewing the classified report detailing those threats. He granted project developer Ørsted a preliminary injunction that allows work to proceed as the complaint moves through the legal system.
It’s the fifth such court order in recent weeks, and a welcome reprieve for a sector that promises to provide huge amounts of clean electricity to the East Coast in a time of surging demand.
In mid-January, the 704-MW Revolution Wind project, which is being developed off the coast of Rhode Island by Ørsted, became the first to receive an injunction. By the end of the month, every project aside from Sunrise Wind had secured a similar ruling and restarted work. Vineyard Wind, an installation so close to completion that it is already partially supplying power to the New England grid, was the latest to do so. Its final turbine tower left the New Bedford, Massachusetts, port last Wednesday.
The December order from the Trump administration ground construction of the megaprojects to a halt, costing developers millions of dollars, delaying the arrival of much-needed new electricity, and threatening the outright cancellation of the multibillion-dollar developments.
It also capped off a yearlong assault from the Trump administration against the emerging sector.
That assault has largely been successful. Offshore wind was once seen as the future cornerstone of Northeastern grids, but now only a fraction of what was once planned for the next decade is likely to get built: Research firm BloombergNEF slashed its forecast for 2035 offshore wind capacity by a staggering 85% between November 2024 and October 2025.
But the Trump administration has, so far, failed to permanently stop the construction of the five projects already underway. It’s not for lack of trying.
Last April, the administration issued a stop-work order to New York’s Empire Wind, one of the five projects that was halted by the December order as well.
The developer, Norway’s partially state-owned energy firm Equinor, declined to sue over the April order and instead lobbied the Trump administration behind the scenes. The administration lifted the order after about one month, which White House officials said was the result of New York Gov. Kathy Hochul (D) agreeing to support new gas pipelines in the state. Hochul denied those allegations, but her administration green-lit one such project in November.
The Trump administration issued another stop-work order in August — this time to Revolution Wind. Ørsted immediately challenged the directive in court and was granted relief a month later.
Rather than targeting any individual project, the December order took a dragnet approach, citing still-unclear national security risks. The Trump administration has yet to publicly release details regarding the alleged threats.
Similarly, the administration has refused to share a National Oceanic and Atmospheric Administration report that it said justified the April stop-work order on the Empire Wind project.
In response to a Freedom of Information Act request from E&E News, the administration last year released a copy of the report that was almost entirely redacted. Instead of providing damning evidence that the Biden administration had rushed the project’s approval or relied on flawed science, as Interior Secretary Doug Burgum had claimed at the time, the file contains a cover sheet and research references — and about two dozen pages of black rectangles.
It’s unclear where the administration will go from here. Several of the five now-unpaused projects will be complete, or at least begin producing power, if they can continue unabated for even a few more months.
Meanwhile, across the Atlantic, the prospects for the energy source are very different.
Last Monday, 10 European nations banded together to announce a plan to install 100 gigawatts of offshore wind in the North Sea. The agreement was motivated in part by Europe’s desire to forge its own path on energy as it grows less comfortable with relying on natural gas imports from an increasingly erratic and hostile United States.
Just days before, in fact, President Donald Trump took time out of his World Economic Forum speech in Davos, Switzerland, to complain about wind turbines — and to call European nations “losers” for installing them.

.svg)
