

 Back
Back
Offshore wind farms not only pose no threat — they provide national security benefits, in addition boosting the grid and economy, according to military experts.
When the Trump administration issued stop-work orders on all five offshore wind projects under construction late last year, it offered one justification: The turbines could compromise national security.
Experts were immediately critical of this assertion, not least because it came after months of unrelenting hostility toward the offshore wind industry from President Donald Trump. Plus, it’s standard practice for the U.S. Department of Defense to assess offshore wind projects, and each one under construction had been thoroughly vetted.
Now, some military experts are going even further, arguing not only that offshore wind poses no threat but that building it can bolster security.
“Offshore wind is not a national security threat — it is a national security imperative,” said Dave Belote, a retired U.S. Air Force colonel and CEO of renewable energy consultancy Dare Strategies, at the National Conservative Energy Summit in Boston this week.
Belote was among a panel of energy experts with U.S. military backgrounds who said the Trump administration’s national security rationale is just plain wrong.
The courts have unanimously ruled against Trump’s stop-work orders, allowing work to resume on all five offshore wind projects. Three are now sending power to the grid. On Thursday, a court ruled against the Trump administration’s use of similar justifications to halt the permitting of more than 150 land-based wind projects, too.
In fact, experts said, offshore wind is vital to national security.
In the near future, for example, the U.S. military is likely to encounter wind turbines in and near the waters off China, where offshore wind is being built at a rapid pace. American wind farms, the panel said, should be considered vital training grounds where radar operators can learn to distinguish spinning blades from other objects, and submarine crews can practice navigating the underwater obstacles created by turbine foundations.
“You don’t get that unless you have an environment where you can practice that first,” said Kirk Lippold, a retired U.S. Navy commander who is now an outspoken advocate for clean energy and energy security.
He also pointed to countries including Belgium and Poland that are using turbines as platforms for additional radar sensors that can improve the ability to detect threats.

The panel also dismissed the Trump administration’s stated qualms about turbine blades making it harder to detect hostile drones. During the original federal approval process, any required national security mitigations were identified and agreed to. And software and well-trained operators can tell the difference between turbine blades and other equipment on radar, Lippold said.
“From a national security perspective, what the administration is saying just doesn’t hold water,” he said.
For supporters of offshore wind, of course, the national security question has always been a red herring. Planned wind farms have long been the cornerstone of the Northeast’s decarbonization and grid reliability goals. The installations already in operation — Vineyard Wind off Massachusetts, South Fork Wind near Long Island, and Revolution Wind off Rhode Island — have helped keep the grid going with emissions-free electricity during heat waves and cold snaps.
There are other benefits as well. Hosting a land-based facility like an offshore wind port can have an economic impact equivalent to an auto manufacturing facility, said John Szoka, CEO of summit host the Conservative Energy Network and a retired Army lieutenant colonel. And the turbine foundations can create valuable habitats for fish and other marine life, he noted.
The panel’s comments give support to those who say Trump’s ostensible security concerns are just a last-ditch effort to kill the offshore wind industry he has been steadily weakening since he took office. Only 6 gigawatts of offshore wind are expected to be completed by 2035, per BloombergNEF — far fewer than the 39 GW the research firm anticipated in 2024.
Trump’s argument, Belote said, strained credulity from the beginning. The area slated for the five offshore wind farms targeted by the stop-work orders amounts to 0.016% of the total area of the Atlantic continental shelf, he said, noting that such a small area could not compromise an entire nation’s security.
“It was ludicrous on its face,” he said.
An update was made on Aug. 6, 2026, after Judge Karin Immergut of the U.S. District Court for the District of Oregon ruled that the Department of Defense must restart reviews for wind projects.
A federal judge issued yet another blow to Trump’s war on wind, ruling that the Defense Department must resume its review of onshore wind permit applications.
The U.S. Department of Defense has for months refused to conduct routine military evaluations of proposed onshore wind farms, creating a de facto moratorium on the clean energy source at a time of exploding electricity demand.
On Thursday, a federal judge appointed by President Donald Trump ordered the agency to resume its reviews — and put an end to that freeze on wind projects. The preliminary injunction requires the DoD to report to the court on its progress every 30 days while the legal case proceeds.
“The court just stopped the Trump administration from misusing a long-standing review process to block the clean, affordable power that Americans need,” Phelps Turner, senior attorney, U.S. Clean Energy, at Environmental Defense Fund, said in a statement. “For months, wind projects capable of supplying millions of homes and businesses with low-cost power have been needlessly obstructed, as electricity costs and demand soar.”
The DoD delays, which began in August 2025 and ramped up to an outright halt this spring, have affected more than 155 projects across 21 states. The Trump administration has cited national security claims to justify this freeze, echoing arguments it made when stopping work on five offshore wind farms late last year. Those stop-work orders were all rejected by the courts.
The renewable energy groups that brought the suit contend that the freeze was never about national security — it was about furthering Trump’s war on wind energy.
Demand for electricity is rising quickly as data centers clamor to connect to the grid. This mad dash for power threatens to drive further increases in electricity costs, which have already ballooned under Trump despite his campaign pledge to cut bills in half.
Wind energy could help ease those rising costs: The energy source already supplied 10% of U.S. electricity last year, and onshore wind is the cheapest form of energy generation to build, according to investment bank Lazard.
Nevertheless, Trump has doggedly pursued a different campaign promise: blocking all wind farm construction.
His administration has fallen short of that dramatic goal — in fact, in June, the largest wind farm in the U.S. went online — but it has notched successes, too.
The administration has crushed the offshore wind industry, with the exception of the five installations off the East Coast. It ripped away tax credits for wind developers in last year’s sweeping One Big Beautiful Bill Act. And in August of last year, it scrapped the beleaguered Lava Ridge Wind Project, a 1-gigawatt onshore wind project that the Biden administration had approved for construction on public lands in southern Idaho.
The DoD freeze is not the first time the Trump administration has used agency reviews to create delays for wind developers.
Last July, the Interior Department created a “choke point” for permitting new wind and solar projects on federal lands by insisting that Interior Secretary Doug Burgum personally sign off on certain permit approvals. In April, a federal judge ordered the Interior Department to lift its blockade while a lawsuit led by industry groups makes its way through court, though the agency appealed the decision in June.
These delays have real stakes. Wind developers that hit certain construction milestones before July 4, 2026, locked in federal tax credits before they expired. But they need to finish construction within four years to receive those discounts.
Further delays, whether from the DoD or from another tactic at a different agency, could cause developers to miss those deadlines — and put projects on shaky financial ground.
ScottishPower’s Whitelee onshore wind farm could double its capacity with far fewer turbines. It’s an example of how much wind technology has improved.
It’s almost an ironclad law: Over time, wind turbines get taller, better, and more cost-effective.
A new proposed project in the U.K. demonstrates that. ScottishPower recently announced its intention to repower the U.K.’s largest onshore wind farm, a process that will involve replacing old turbines with state-of-the-art new ones. Once that is done, the wind farm will produce twice as much power with almost half the number of turbines.
The Whitelee wind facility, near Glasgow, was completed in 2008. The developers installed 140 turbines that stood 360 feet tall at the highest blade tip and could generate 2.3 megawatts each. By 2013, the site had been expanded with 3-MW turbines that stood 459 feet. Since then, Whitelee has produced up to 539 MW from its 215 turbines, storing some of that in a 50-MW battery on-site.
If the forthcoming upgrade gets regulatory signoff, the old turbines will be taken down and in their place will rise 124 new ones, measuring 787 feet tall and producing around 7 MW apiece. Collectively, they will be able to generate more than 1 gigawatt of carbon-free power when the wind blows fiercely.
“Repowering allows SPR [ScottishPower Renewables] to reuse existing site infrastructure and take advantage of new technologies resulting in increased electricity generation and ultimately, increased security of supply,” the company noted in a scoping document.
It’s a striking example of how far this clean energy technology has advanced in recent decades. Modern turbines have pushed to incrementally higher heights and broader wingspans, allowing them to generate far more electricity than their predecessors — and to do so at a cheaper unit price. This evolution supports onshore wind’s position as the cheapest of all the electricity sources on an unsubsidized basis, per the latest analysis by the financial advisory firm Lazard.
Repowerings like Whitelee’s could help the U.K. and the European Union shore up their energy security as the natural gas supply chain remains in war-torn upheaval. And while the U.S. government currently seeks to thwart this affordable energy source, there are signs that repowerings could add significant capacity in the coming years.
The main appeal of repowering is to access the much greater clean power generation — but there are other benefits, too.
“It doesn’t take twice as long to service a turbine that’s twice as big, and you don’t have to do two foundations — you only need to do one,” said Kaj Skov Nielsen, a longtime wind power specialist who helped set up the control system at Whitelee.
Installing a new turbine also gives project owners an easy opportunity to add state-of-the-art sensors, Nielsen said. New sensors can detect birds and bats and slow the blades’ rotation to protect them. Others can spot potential mechanical issues, like debris that could cause problems in the gearbox, before they become catastrophic.
Older turbines have control systems that can stop the blades if they detect a fault. Newer systems can slow the rotation to a safe level based on the specific fault that is happening, Nielsen said, eking out more generation without endangering the equipment — “it’s a totally different game.”
That’s not to say repowering is easy. Larger equipment may exceed the weight limits on the roads and bridges to the project site, or height limits on underpasses along the route, Nielsen noted. Developers need to weigh the cost of upgrading that transportation infrastructure against the alternative of shipping in pieces and assembling them on-site, which adds more work on the back end. A developer also needs to strengthen foundations to support the weight of much larger turbines.
ScottishPower still needs consent from the Scottish ministers for the repowering, so it will go through a detailed assessment for impacts on the community and the environment. The repowering project has two big advantages in that process, compared with a brand-new project: It already secured permission to build many more turbines on the same land, and it would upgrade capacity without expanding into undeveloped countryside.
ScottishPower, for its part, has tried to make Whitelee welcoming to the broader community. The energy company acquired the site after it had been used for commercial logging and has invested in wide-scale restoration of the underlying peatland ecosystem. People can bike or hike around the premises, take guided bus tours, and enjoy the views from a visitor center that touts its “delicious cakes” from local vendors. The power company markets it with the hashtag #MoreThanAWindfarm.
Turbines of the size proposed for Whitelee have just started getting installed around the world, said BloombergNEF wind analyst Harrison Sholler. Chinese manufacturers have been pushing the boundaries of onshore turbine size, but those units are typically shut out of Europe and the U.S. because of geopolitical concerns. Instead, developers in those regions turn to manufacturers including Siemens Gamesa, Vestas, and Nordex, all of which now sell 7-MW onshore wind turbines; or GE, which has onshore models up to 6 MW.
A project in Brazil’s Bahia state installed a new 7-MW turbine last fall, touting it as the largest onshore turbine in the Americas.
“It’s established technology in the sense that they’re not that different from a 6-MW turbine, for example,” Sholler said. “They’re considered by the industry to be proven at scale.”
The U.S. might not have any turbines that big yet, but it does have plenty of installed turbines of the smaller vintage that ScottishPower seeks to replace. The U.S. average onshore wind turbine capacity has steadily ticked up from 0.8 MW in 2000 to 1.8 MW in 2010 to 3.5 MW in 2024, per the most recent accounting by Lawrence Berkeley National Laboratory. The country’s first 6-MW-turbine project came online that year in Oklahoma.
Of the 86 GW of new wind capacity BNEF expects the U.S. to build over the next decade, 10 GW will come from repowering, said Sholler. “Towards the early to mid-2030s, we expect repowering activity to ramp up as some of the larger wind farms are reaching the end of their operational life,” he noted.
BNEF expects the Northwest and Midwest will build the most repowered wind capacity in the next 10 years, with significant capacity popping up in Texas, California, and the mid-Atlantic. In California, repowerings will provide pretty much all new onshore wind capacity in that period, Sholler said, because all the good sites for onshore wind farms got developed decades ago, starting when the state initiated a subsidy in the 1980s.
That said, the largest U.S. repowering on BNEF’s radar for the next decade clocks in at just over 200 MW, a far cry from the projected 1 GW at the refurbished Whitelee.
“I don’t think we’re at the stage of market maturity where we’re starting to see those larger-scale projects start to repower in the U.S.” Sholler said. “But we will get there eventually.”
Illinois community solar incentives spurred plans to put 60 arrays on top of Public Storage facilities in the state. So far, 10 are online.
Krzysztof Wasowicz, mayor of Justice, Illinois, has some concerns about solar: that it takes up farmland and enriches China. But he’s all-in on the community solar array that was recently deployed at a Public Storage facility in his village, a suburb of Chicago.
The panels are located on otherwise unused roof space and could provide significant savings for Illinoisans who subscribe to the project, while also helping the state meet its goal of 100% clean power by 2050.
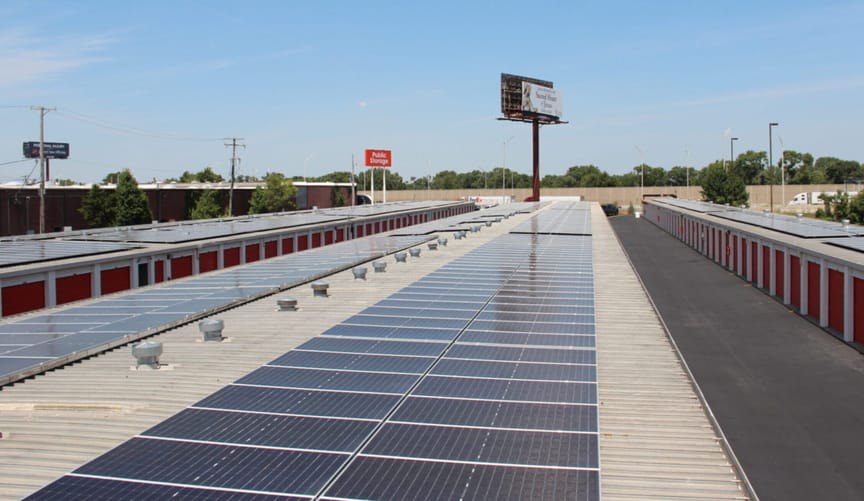
“This creates more opportunities for people, job creation, and revenue that can be taxed by our state,” said Wasowicz, who has been mayor of Justice, home to about 12,000 people, since 2007. “This is going to be an excellent addition to this village.”
The 763-kilowatt array, which went online in March, is one of 60 planned projects for the rooftops of Public Storage facilities in Illinois. Ten such projects are now online, and once completed, the portfolio will cover 5 million square feet of roof space, provide 44 megawatts of solar capacity, deliver $36 million total savings, and create 300 construction jobs, according to Solar Landscape, a leading developer of rooftop community solar sites nationwide.
Only a fraction of industrial and commercial roof space is currently used for solar, because those projects are generally more expensive to build and interconnect than ground-mounted arrays in rural areas. But thanks to new incentives, developers, utilities, and building owners nationwide are increasingly considering the possibilities.
Federal data analyzed by the solar company Lumen Energy found that commercial, industrial, and school rooftops could host enough panels to provide 581 gigawatts of power, nearly enough to meet the entire country’s energy demand. Cook County, Illinois, which includes Justice, is among the metropolitan areas with the greatest potential, that analysis found.
Mark Schottinger, president and chief legal officer of Solar Landscape, said that working with large companies like Public Storage allows his company to deploy rooftop projects quickly at multiple sites.
“The beauty of commercial-industrial real estate is the speed and scalability,” he said, noting that major logistics, storage, and big-box companies “have millions of square feet around the country.”
Community solar allows households, businesses, and organizations to reap savings and support clean energy even if they can’t have their own solar panels. By subscribing to a community solar array, customers get credit on their energy bill for a portion of the solar power generated.
Illinois is among the nation’s leaders in community solar capacity, according to the Solar Energy Industries Association, with more installed than even California. It is among the two dozen states that have laws enabling community solar, which typically leads to more arrays than in states without specific policies.
Illinois’ 2016 clean energy law created generous incentives for community solar, leading to a boom in projects of up to 2 MW each. An energy law passed last fall made the incentives available for projects of up to 10 MW.
Most of the state’s community solar has been built on rural land or industrial brownfields. About a fifth of the arrays are on rooftops, with the rest being ground-mounted. The rooftop arrays are concentrated in the Chicago area, and rooftops are an increasing priority for community solar, according to Paul Kovacs, project execution manager for distributed energy resources for utility ComEd, which serves northern Illinois.

At a July 30 event promoting the Justice project, Melissa Washington, ComEd’s senior vice president for government relations and external affairs, called rooftop community solar “an elegant solution” for deploying clean energy to meet rising demand.
She listed three mandates for the utility: supplying power to businesses and residents, keeping electricity affordable, and addressing climate change — a necessity underscored by violent storms three days earlier that had left many ComEd customers without power.
Rooftop community solar, she said, “checks the box for every single one of those three critical priorities.” The utility plans to have over 400 community solar arrays in service by the end of this year, she added. Kovacs said about 100 of those will be on rooftops.
In a typical setup, a company like Solar Landscape develops and owns the array and collects revenue from incentives and subscribers. Those subscribers get savings on their energy bills, the property owner hosting the panels gets lease payments, and the utility gets credit toward renewable energy mandates. The utility works with the developer to make any upgrades needed to connect the array to the grid, which the developer pays for so that costs are not passed on to ratepayers.
The Public Storage projects are part of Illinois’ Community-Driven Community Solar program, meant to incentivize solar arrays whose subscribers are predominantly local households and small businesses or nonprofits, as opposed to a few large subscribers hogging the savings.
Under state law, owners of community solar can sell renewable energy credits to utilities for revenue that makes the financing equation more favorable for all the partners involved. The incentives are awarded through a highly competitive process, and proposals gain points for being in designated low-income or environmental justice census tracts, having a large proportion of local subscribers, involving the community in design and planning, and hiring through the state’s workforce training programs, among other factors. The community solar credits are also worth $5 more per megawatt-hour for rooftop installations.
The Justice project earned points for making charitable contributions and for hosting a workforce training program in conjunction with the New Jersey–based training and education nonprofit STEP-UP Solar, according to Solar Landscape marketing director Samantha Kanipe.
State incentive programs are critical to facilitating community solar development since the expiration of federal tax credits under the Trump administration’s 2025 spending bill, advocates note. Meanwhile, arrays on industrial and commercial sites, like the Public Storage ones, can still qualify for federal tax credits if they are operational by the end of 2027, or if they started construction by July 4 of this year.
“We began construction on a ton of projects before July 4,” including all the Public Storage ones, said Schottinger of Solar Landscape, noting that his company can build an array like the one in Justice in about six months.
He said his company and other solar developers are still in the “early innings” of using rooftops for community solar. But, “it’s growing exponentially,” he added. “There’s a lot of blank space out there.”
Building trades spent the past five years preparing for an offshore wind boom that went bust, leaving workers to mourn good-paying jobs that may never come back.
This article originally appeared on Inside Climate News, a nonprofit, nonpartisan news organization that covers climate, energy, and the environment. Sign up for their newsletter.
When Gerard Mullin decided to train in offshore wind, he didn’t know what to expect. But on his first long-term project in Massachusetts, he immediately relished the consistency of the work, the good pay, and the novelty of laboring at sea.
“I thought it was the best thing in the world,” he said.
In his first eight weeks working offshore, Mullin made more money than he had saved in the previous five years.
But the industry was on shaky ground. Mullin had his bags packed for five weeks offshore with Empire Wind in New York when President Donald Trump’s stop-work order last year stranded him at home in Boston. Trump — who had railed against the industry in his 2024 election campaign — halted all future permitting last year and canceled 12 offshore wind leases this spring and summer.
Thousands of workers like Mullin who were promised steady, well-paying careers in offshore wind now find themselves racing to secure the few positions left or returning to their prior work. Meanwhile, the supply chain that emerged to support offshore development has been left adrift, including in towns in need of a promised economic boost.
Those are less-discussed consequences of the political turmoil besetting the domestic industry, said Elizabeth Wilson, a professor at Dartmouth College studying offshore wind.
“All of the promises of economic development that offshore wind was supposed to help support have evaporated,” Wilson said.
For Mullin, the change was shocking.
“All of a sudden, the federal government is concerned with my work, and there’s nothing I can do to change how they view it,” Mullin said. “Now there are things completely outside of my control, changing how I make a living.”
Trump has long scorned offshore wind, calling the 2012 project he unsuccessfully opposed near one of his Scottish golf courses “disgusting & inappropriate.” His administration, which has inaccurately described renewables as costly and unreliable as it tries to block them in favor of climate-altering fossil fuels, said his offshore wind policies are good for the economy and workers.
“President Trump has delivered on his popular promise to reverse the Left’s costly Green New Scam to lower prices for families and businesses and strengthen our country’s energy security,” Taylor Rogers, a White House spokeswoman, said in a statement. “By prioritizing the production of reliable, affordable, and secure energy sources, the President has restored U.S. energy dominance — creating thousands of good-paying energy jobs across the country.”
Tim Sullivan, who was CEO of the New Jersey Economic Development Authority until December, said he can’t comprehend the White House’s logic.
“It’s the strangest thing: I’ve spent 15 or so years working in public-sector economic development; I’ve never seen people cheering for job destruction, particularly elected officials,” he said.
As a pile driver, a specialized structural laborer essential to offshore wind projects, Mullin lived and worked on a ship five weeks at a time, followed by five weeks at home with his family. It was a schedule that suited him well.
Mullin joined offshore wind projects across Massachusetts, Virginia, and New York. His employer, an international contractor, even brought him and other members of his union across the Atlantic for a wind project off the coast of Scotland.
Now, Mullin is back to the same type of onshore construction work he did four years ago, before he started with wind.
“The writing was on the wall that this idea that I’m going to go to the same ship, five weeks on, five weeks off, steady — that just isn’t the reality anymore,” Mullin said.
Joshua Grigsby, 42, took his son to Rio de Janeiro, Disney World, and SeaWorld. Natalie MacDonald, 26, stopped living paycheck to paycheck. Others bought homes and started families.
Inside Climate News spoke with over a dozen workers and union leaders who said the financial opportunities from the nascent U.S. offshore wind industry had been unparalleled. They saw long-term careers ahead of them. They feel that opportunity slipping through their fingers.
Anthony Hibbard was on one of the first boats that carried ironworkers to Vineyard Wind, off the coast of Massachusetts. What he found was “financial freedom,” he said, and he worked his way up to become a foreman on Coastal Virginia Offshore Wind.
After the Trump administration’s moves to scuttle the industry, Hibbard returned to local, onshore jobs in Portland, Maine, where he earns just one-fifth of what he did offshore.
“I make enough to get by, but I like to be smart with my money, and I don’t have the scope to continue being smart with it,” Hibbard said. “It’s definitely — you can feel the difference, that’s for sure.”
The loss of offshore wind has had financial consequences for many union workers. While many were paid the same per hour as jobs they could find onshore, they could work more than double the hours, and the company covered many living expenses. Grigsby made double to triple what he did onshore.
When Zaheer Razi, 28, joined the Piledrivers Local 56 union as a commercial diver, he transitioned into offshore wind as soon as he could. The logic was that it could be the anchor for people’s careers, he said — union leaders told workers to “set your roots down,” expecting over a decade of steady work.
He’s still working on Revolution Wind near Rhode Island, but he knows it won’t last.
“I’m probably one of the few guys that’s probably going to be working till mid-August, I believe, and then it’s really going to be silent for the next two or three years,” Razi said. “It is very frustrating, but it’s out of our control. Nobody could have really predicted it, but at this point, we’re just riding it out for what we can.”
Razi’s project is one of the five major U.S. wind farms that appear to remain on track despite the political backlash. But they are nearing completion and the permitting pipeline is all but blocked, meaning construction jobs will soon evaporate, according to multiple experts and union leaders.
Kris Ohleth, director of the Special Initiative on Offshore Wind, a U.S. policy think tank, attributed the lack of employment prospects to the political uncertainty that has stymied investor interest.
“We’ve trained them, we’ve given them this great experience, they’re building their futures for their families, and now they have no projects to work on,” Ohleth said of the offshore wind labor force, “and that’s because of the lack of market confidence.”
At the time of Trump’s election, the market research firm BloombergNEF forecast that the United States would build 39 gigawatts of offshore wind by 2035, enough electricity to power 13 million homes. By the end of last year, the firm had downgraded that prediction to just 6 gigawatts, according to Harrison Sholler, a wind analyst at BNEF.
For Garrison Biel, an offshore wind diver, the industry’s decline has meant there are close to no employment opportunities left.
“They’re more gigs than jobs,” Biel said. “They’re like short hitches, trying to wrap things up, tidy everything up. So I know people that are still working, but it’s not like how it was the first couple of years when it started, where that’s all you needed to do.”
He switched back to commercial diving around eight months ago because “what was available left offshore was slim pickings,” he added.
Biel said the offshore wind industry was supposed to be reliable, with guaranteed time off to make up for the long periods away from home and the weeklong, 12-hour-per-day shifts.
“Now, everybody that’s doing it, they get off the boat after working seven-twelves for a couple of weeks and they go right back to work, because they don’t know if they’re ever going to go back out on a boat again,” he said.
Grigsby was able to buy a house with his money from offshore wind. His union’s business manager, John Dunderdale, said at least a dozen other members of Piledrivers Local 56 did the same.
When these projects disappear, “you’re taking away their means of bringing back into the community,” Dunderdale said.
“Now you have a member sitting home, collecting unemployment, because there’s no work,” he added.
Benjamin Hawkins, who lives in Whitman, Massachusetts, said he made enough to upgrade his parents’ house and enjoy a new degree of “leverage” over his life.
“It’s heartbreaking, because you wonder about what’s going to happen in the future with your money,” Hawkins said.
He added: “Offshore wind was the reason I could improve that life, so to have the president affect my life, just as an average American — it was not on my bingo card.”
Offshore wind first began edging into the U.S. energy market in 2011, decades after it had taken off in Europe. An Obama administration study that year predicted that a vibrant offshore wind industry could help meet the nation’s renewable energy needs while investing in infrastructure and creating “thousands of construction and operational jobs.”
The first U.S. offshore wind farm, Block Island, came online near Rhode Island in 2016, and states began offering financial incentives to drive development. The Biden administration made offshore wind a central priority in 2021, and from there, state and federal agencies geared up for a boom. The federal government sold leases to major international energy companies that began to see the U.S. as an attractive market, centered in the Northeast, Virginia, and California.
Construction and permitting began in force not long before Trump returned to office with a promise to kill offshore wind.
“That’s like somebody working on skyscrapers, and then somebody saying, ‘We’re not allowed to build any skyscrapers,’” Biel said. “It’s just a kind of crazy thing.”
No comprehensive or exact estimate of offshore wind-related jobs exists, but New Jersey’s Economic Development Authority estimated in 2022 that a typical project creates around 1,000 construction jobs per year and 100 lifetime operational jobs.
Dunderdale said shutting down any project at that size and scale is a “huge hit,” both for the workers and their local economies.
Central to the fledgling domestic industry was the growth of training and certification programs, primarily through community colleges and unions.
Millwrights Local 1121, which operates across New England, met with developers in 2021 to start offshore wind job training, which would cost $10,000 to $20,000 per person. It was worth it, said the union’s vice president and business manager, Andy Benedetto, because they had heard there would be “years’ and years’ worth of work.”
“We invested millions of dollars in training, more or less, and lots of hours went into putting all this together, and now that work is dried up for the foreseeable future,” Benedetto said. “We hope not too long, but we built this whole workforce, and we sold this dream to our members that if they get involved and get the training and go on this first project, then they’re going to carry over for the next 10 years.”
His union wasn’t alone. Public and private investments poured in to develop the new workforce. New York, New Jersey, and Massachusetts led the Northeast with millions of dollars in grants to training and research programs.
Ironworkers Local 7, which operates across the Northeast, received $300,000 from Massachusetts in 2022 “to be ready for when the work comes,” said Grant Provost, the union’s Maine business agent. “And the work never really came.”
Dunderdale helped build the only U.S.-based school with heavy-lift training for Piledrivers Local 56. In total, offshore wind training cost the union about $30,000 per person, which he said was “an investment in the member.”
Esther Rosario, executive director of the labor coalition Climate Jobs New York, said unions that spent years preparing for the offshore wind economy have to reassess their plans.
“We’re ready to work, we’re ready to build, we have the trained workforce — we need work,” Rosario said. “You can’t apprentice somebody into a job that doesn’t exist.”
Offshore wind was billed as a boon not just for the building trades but for the entire economy. Manufacturing would move to the United States and locals would fill those jobs. For port cities like Massachusetts’ Salem and New Bedford, or New Jersey’s Paulsboro, the loss has threatened years of expected economic progress.
In August 2025, Trump canceled a $34 million grant to build an offshore wind terminal in Salem, which Frank Callahan Jr., president of the Massachusetts Building Trades Unions, said at the time put 800 construction workers out of a job.
“It means fewer jobs, fewer career opportunities,” Callahan said in a recent interview. As an example of this loss, he pointed to Prysmian Group, an Italian manufacturer, abandoning plans in January 2025 for an offshore wind cable plant near New Bedford.
At one point, Salem County, New Jersey — one of the state’s poorest counties — was poised to gain 1,500 new jobs for its population of 65,000.
“That’s a huge inflection point in that county’s economy that at this point is hard to see materializing anytime soon,” said Sullivan, the former New Jersey official.
The thousands of offshore wind workers aren’t all suddenly unemployed. Most did some trade work before, and unions are used to moving members onto different projects when conditions shift.
Still, Provost, the Ironworkers business agent, said offshore wind is a huge dent in unions’ portfolio of opportunities.
“If we’re not building offshore wind, and we’re not building jobs like that, you got to get in on university- and state-funded projects, and that doesn’t keep everybody busy,” Provost said. “We’ve got a massive amount of unemployed people in Local 7 right now.”
And just because workers can transition doesn’t mean they want to.
If he had a choice, Hawkins said, “I’d never work on land again.”
In addition to the financial opportunity, Razi said offshore wind was a once-in-a-lifetime experience.
“We were meeting people from all over Europe, all over the world, and it was just a great environment to learn as somebody being in their mid-20s,” said Razi, who is finishing up an offshore diving job.
Living and working together consistently for weeks on end, crews became good friends, even vacationing together and learning each other’s languages. Hawkins joked that every rigger knew how to curse in at least three languages.
“It’s like being at the U.N.,” he said.
Benedetto said the millwrights he represents are eager to return to offshore wind, but they feel burned by political headwinds turning against them.
“They did a good job,” he said, “and they’re bummed out that they’re middle-class workers being used as pawns.”
Last November, Mullin’s building in Boston caught on fire, and he lost everything he owned. Six weeks later, he said, he was able to buy a condo near the city.
“That would not have been possible without offshore wind,” he said.
Mullin said he wishes others, especially young people entering the trades for the first time, could have the opportunity he did.
“It’s just too bad because they were good jobs and people were happy with them,” he said. “And it really was just a fair day’s work for a fair day’s pay.”
While the industry has suffered the loss of federal tax credits and other economic hits, leasing and batteries make the panels pencil out for many homeowners.
Stew Miller, who launched his North Carolina rooftop solar company in the 2000s, says there’s “a lot of negativity” in his industry right now — and it’s easy to see why.
A year ago, Republicans passed the One Big Beautiful Bill Act eliminating the 30% federal tax credit for households who buy rooftop panels. That blow came on top of an array of economic headwinds, including tariffs, stubbornly high interest rates, and, in many states, reduced bill credits for the electrons solar customers added to the grid.
After the tax incentives ended last December, the market for new solar panels fell sharply nationwide, and North Carolina was no exception. Between the fourth quarter of last year and the first quarter of 2026, new rooftop solar installations in the state dropped by two-thirds, according to estimates from the North Carolina Sustainable Energy Association.
And yet, despite that grim data point, Miller of Yes Solar Solutions and other installers interviewed for this story stress that they’re doing better than they expected. While the North Carolina Sustainable Energy Association says the number of rooftop companies in the state has shrunk — mostly because of the departure of national outfits — the firms that remain are now seeing sales rise after their initial freefall this winter.
“I would tell you if we were struggling,” said Jesse Solomon, vice president and director of sales at NC Solar Now. “But we just had a record month.”
Driving the current upswing is the fact that home solar is penciling out in surprising new ways. Options for customers to lease panels rather than buy them, incentives for batteries, and rising electric rates all mean that households may be able to install solar with almost no money down and start saving on their electric bills from day one.
“People were scared when we lost the tax credits,” Miller said. “But people are still installing solar systems, the prices of solar have come down dramatically, [and] there are financing programs, with these leases, that allow people to put solar on their homes with little to no cash up front.”
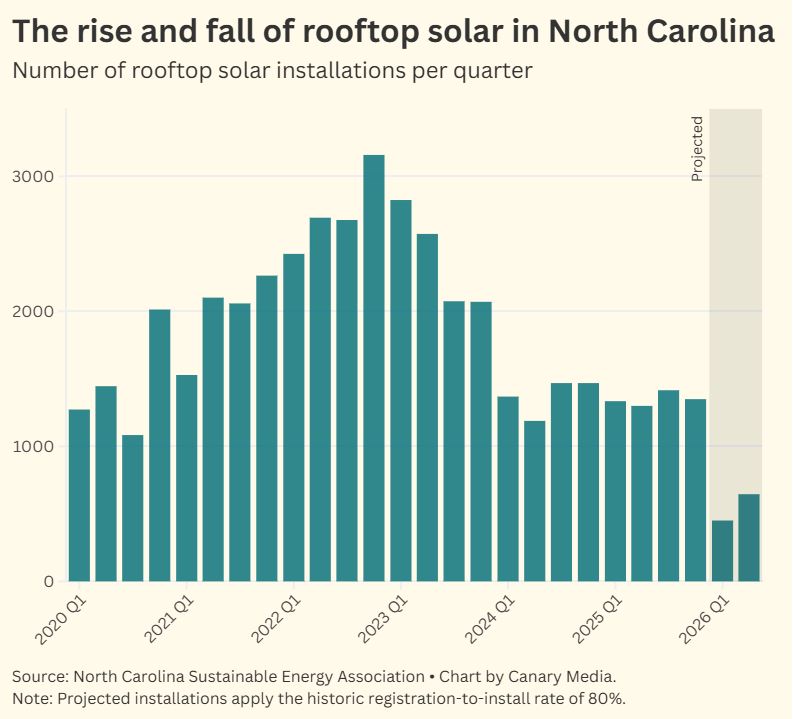
A national leader in large ground-mounted solar projects, North Carolina is just in the middle of the pack when it comes to rooftop solar, with only about 58,000 home arrays in this state of 11 million people.
That’s primarily because it’s long been cheaper for most households to buy from the grid than to produce their own solar power. Duke Energy, the investor-owned utility that covers most of North Carolina, has historically had relatively low rates. State law prevents any party other than Duke from selling electricity, reducing competitive pricing. The company’s rebate program for solar arrays was effective but short-lived, and Duke pays grid-connected customers less for excess solar electrons than it used to.
But now, many of these dynamics are shifting, altering the finances of home solar.
Third parties still can’t sell electrons directly. But under a 2017 state law, they can rent the solar equipment itself to customers in Duke territory — up to a certain cap.
The provision was little used in North Carolina until last fall. But it became crucial after the passage of the GOP budget law, which still offers commercial entities a 30% tax credit for solar arrays through at least the end of next year.
That means installers and other third parties can access the incentive and pass the savings on to residential customers. The models for doing so vary, but rooftop companies say the bottom line is similar across the board: Many solar customers can immediately start paying less each month for their electricity.
“Leasing is now alive and well,” said Clary Franko, chief operating officer of Asheville-based Sugar Hollow Solar, who noted at least half of her customers are going that route. “It’s actually the most cost-effective residential option I’ve seen yet in North Carolina.”
Some installers are offering their own leases. Others are partnering with one or more of the 20-some third-party lessors registered with state regulators, including homegrown companies like Durham’s Enerwealth Solutions.
The deal can be even sweeter for Duke customers who pair solar with battery storage. Through programs called EnergyWise Home and Power Manager, those households get a monthly incentive for allowing the utility to tap their batteries 30 to 36 times per year.
“The average battery that we’re installing is an additional 50 bucks a month,” said Graham Alexander, an owner and solar energy designer at Southern Energy Management, which opened its doors in Raleigh in 2001. “You, as a homeowner, get the money — that’s great. The utility benefits because they get more load stability with being able to deploy those batteries.”
Another key economic driver of solar adoption in Duke territory is rising electricity rates. Residential bills have jumped by over 20% in the last five years, and the company wants to raise them by as much as another 10% over the next two. Households pay 100% of the cost of the fuels in Duke power plants, sending bills even higher.
It all adds up, said Bryce Bruncati, director of residential sales at Raleigh-based 8MSolar. He recently worked with a customer whose Duke Energy bill had jumped to $420 a month. But with a new solar array and two batteries, “he’s swapping that out for a $160 payment. All he had to do was sign for the lease,” Bruncati said. “There’s no down payment, nothing like that.”
Still, installers say not all customers prefer leasing, and the option may not be widely available after next year if state and federal law remain unchanged. What’s more, bill credits for solar households in Duke territory will decrease again on Jan. 1, 2027. And revised state electrical codes could soon add to installation costs.
While few dare to dream about it under current political conditions, the return of the 30% federal tax incentives would certainly make those coming hurdles easier to clear.
“Anybody would really value and appreciate having those back,” said Matt Abele, the executive director of the North Carolina Sustainable Energy Association. “Those tax credits are reinvestments directly into ratepayers’ pockets.”
Despite all the ups and downs, veteran installers say they are feeling optimistic.
“We think that it’s great to be able to help people with a product that’s actually benefiting them — and the world on a large scale,” said Solomon of NC Solar Now. “And there’s just tons of room for growth. My favorite thing is when I fly out of Raleigh or Wilmington, and I look at all the roofs.”
The cost of installing solar panels will rise. But now the U.S. has a large and fast-growing solar manufacturing industry to take advantage of the trade protections.
A far-reaching new tariff on solar imports promises to both raise the cost of installing the clean energy source and strengthen efforts to reshore solar manufacturing.
The White House announced the new tariffs Thursday on imported polysilicon and related products, including silicon-based solar panels and their precursor components. The decision came out of an investigation under Section 232 of the Trade Expansion Act of 1962, which allows the president to restrict trade over national security concerns. Polysilicon is the crucial input for computer chips as well as most solar panels.
Back in the first Trump term, competition from China had nearly eliminated solar manufacturing in the U.S. A small but vocal contingent of lingering or bankrupt manufacturers successfully pushed for new solar tariffs over the vociferous complaints of the far bigger population of installers and developers who stood to suffer from the higher input costs.
Then, in 2022, the Biden administration passed the Inflation Reduction Act, which created domestic manufacturing incentives for clean energy. It also embraced certain tariffs on foreign solar. The combination of proactive incentives and protective tariffs has since succeeded where tariffs alone had not: The U.S. became self-sufficient in module production in just a few years, with far more modest progress on cells and other components.
These days, developers of large solar projects routinely tout their “Made in the USA” credentials. A recent groundbreaking for an enormous solar-battery plant in Arkansas, for instance, highlighted the project’s use of domestic panels from First Solar, domestic trackers from Nextpower, and steel piles from a steel mill down the road.
The new tariffs stand to benefit a solar manufacturing industry that has grown immensely since the tariff battles of Trump’s first term. But this solar trade protectionism is also certain to raise the cost of building new solar farms — the main new source of electricity in the U.S. — at a time when power bills are already soaring.
Here are the key facts for understanding the new tariffs and how they’ll affect the future of clean energy.
On Dec. 4, the U.S. will enforce minimum prices for the following imports:
The decision also imposed a 15% ad valorem duty on polysilicon derivatives.
The December start date has rankled some supporters of the tariffs.
“It gives importers a window to surge product into the U.S. market before duties take effect, which is precisely the kind of behavior our trade laws are designed to prevent,” said Tim Brightbill, an attorney who has successfully petitioned for solar tariffs for years. “It will be critical that the government rigorously enforce the rules against stockpiling so that importers cannot undermine the remedy before it is even in place.”
Trump picked seemingly arbitrary tariff rates for most of the world in April 2025, reshaping the flow of global trade until even the conservative Supreme Court declared he lacked the legal authority to do so.
The Section 232 tariffs come from a different process that has a strong legal footing. The statute gives the president broad authority to impose tariffs for strategic industries after an investigation by the Commerce Department. Trump has previously used this process to raise tariffs on items such as steel and aluminum, and those tariffs have held.
The U.S. builds more solar farms than any other electricity source. But the Trump administration has not been friendly toward solar developers: It’s removed tax credits for solar installations, obstructed permitting processes, and espoused plenty of anti-solar rhetoric.
The new tariffs add more costs onto the list of things developers have to worry about. The most pronounced impact will come from the added costs for polysilicon, ingots, and wafers, because the U.S. lacks the capacity to produce these at anywhere close to the levels needed to meet the current domestic demand.
As of this summer, the U.S. has 10.6 gigawatts of operating cell capacity, according to the Solar Energy Industries Association. The new cell tariffs should drive additional demand to Qcells, ES Foundry, Suniva, and Silfab — the only companies producing that item domestically. That will still leave tens of gigawatts of annual installations exposed to higher prices for cells that will have to be imported.
“The U.S. will remain dependent on importing cells, wafers, ingots, and/or raw polysilicon for the foreseeable future,” said Pavel Molchanov, a cleantech investment analyst at Raymond James.
The median price for solar modules in the U.S. is 27.1 cents per watt, according to the database compiled by Anza Renewables; that reflects a mix of domestic and imported modules. This means the new floor price for imported panels will be 40% higher than the current median price on the U.S. market.
Modules assembled in the U.S. from imported materials cost 30 cents per watt; now, the cells that go into those modules will have a minimum import price of 22 cents per watt.
The median price for domestic modules using domestic cells is 47 cents, per Anza. Those panels could become even more expensive if the manufacturers can’t get their hands on domestic wafers.
The U.S. already had among the most expensive solar module prices in the world thanks to previous tariffs; the new price floor will be nearly five times the global benchmark price, Molchanov noted.
The decision provides for tariff exemptions if companies get Commerce Department sign-off on plans to build factories by Jan. 20, 2029. This could mitigate tariff-driven price increases while ingot, wafer, and cell capacity grows to meet demand.
Tariff supporters see this as a vital tool to protect the fledgling U.S. solar manufacturing base and drive further investment in the trickier, more expensive stages of the supply chain. Since it’s a global tariff, it could finally end the long-running Whac-A-Mole problem in which U.S. tariffs belatedly catch up to Chinese manufacturers setting up shop in new countries.
“Every time U.S. cell and module producers seek trade relief, the Chinese companies shift their unfair trade practices to other countries,” said Brightbill, a partner at Wiley Rein LLP. “We are hopeful that if this Section 232 action is done right, it could be an important step toward addressing this problem.”
This is a good moment to be Qcells, the subsidiary of Korean conglomerate Hanwha that invested more than $2 billion to build a combined ingot, wafer, cell, and module plant in Georgia. Cells started rolling off the line in June, and the ingots and wafers are set to enter production later this year. Hanwha’s stock price surged by 17% after the announcement, though it has since subsided somewhat.
Longtime U.S. manufacturer First Solar stands to benefit as well, as its cadmium-telluride thin-film technology does not rely on the silicon supply chain. The company can sit back and watch its competitors scramble to figure out the new realities of global trade in silicon. Not surprisingly, First Solar CEO Mark Widmar hailed the 232 outcome as “one of the most strategically significant trade measures in decades.”
But a cohort of manufacturers could be caught in an awkward transitional phase: Their module production will be protected from foreign modules, but their own costs will go up unless more cell capacity comes along.
Panamint Capital broke ground on a $1.7 billion solar and storage project at the Calvert coal mine. The mine and an adjacent coal plant will stay online.
Construction is underway on a $1.7 billion solar and battery storage project in Texas that will turn existing coal mining land into a hub of clean energy generation.
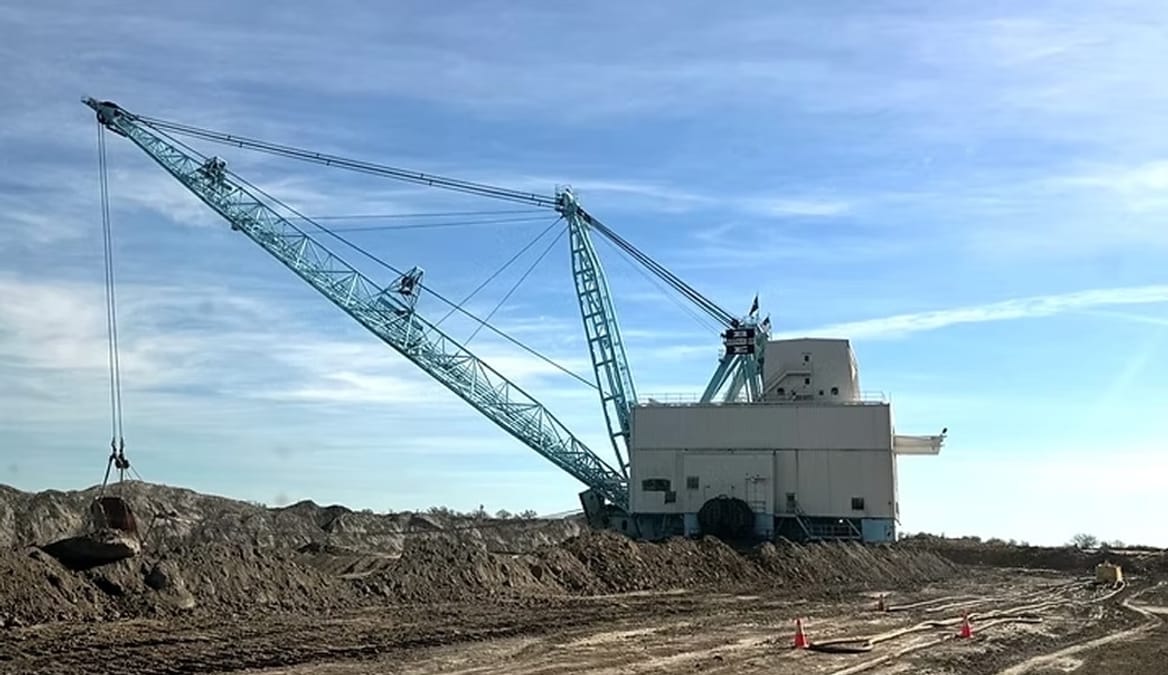
Panamint Capital announced last week that it broke ground on the 1.2-gigawatt Big Rooter Power solar farm in Bremond, about halfway between Dallas and Houston. The project will use some of the land and assets from the adjacent Twin Oaks coal-fired power plant and Calvert surface coal mine, both of which will continue operating.
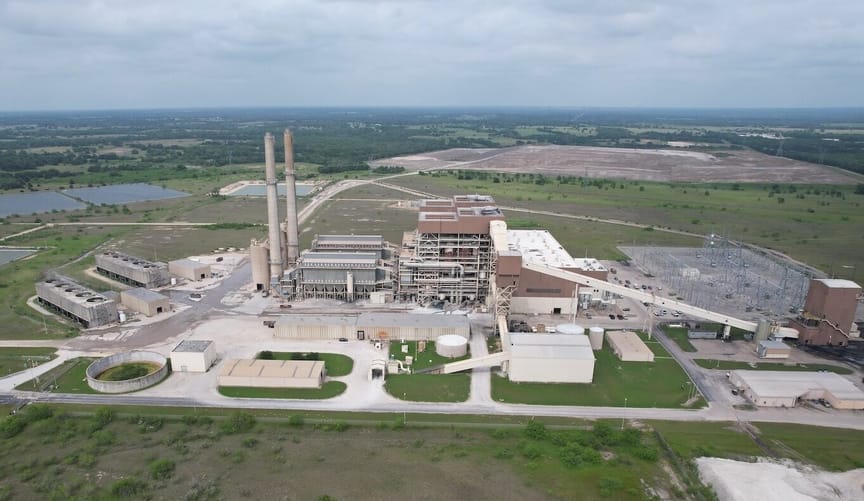
Panamint’s clean energy project will be among the largest in the nation — and, the developer claims, the biggest solar array ever built at a brownfield site in North America.
“We believe deploying new capacity at existing energy sites is the clearest way to benefit communities, ratepayers, and the environment alike,” said Apolka Totth, CEO of Panamint, a Nevada-based investment firm.
The giant installation will further boost Texas’ thriving solar sector, which this year is expected to generate more electricity than coal in the Lone Star State. The renewable resource is helping meet the state’s energy demand from data centers, manufacturing facilities, and rising air-conditioning use amid more frequent and extreme hot weather.
Panamint, which is backed by the private equity firm KKR, launched in 2019 with the goals of squeezing more life out of existing fossil-fuel infrastructure while building lower-emission facilities on the same sites. In 2023, Panamint acquired the 310-MW Twin Oaks coal plant and Calvert mine “with the express intention of leveraging the site’s existing characteristics to massively and rapidly expand generating capability at the lowest possible cost,” Totth said by email.
Work has started on the first phase of the solar farm, a 491-MW section that is set to go online in August 2028. Construction will begin in December on the remaining 658 MW, which could start producing power in August 2029.
The 10,000-acre Big Rooter site will also include 1.6 gigawatt-hours of battery storage and 20 miles of new extra-high-voltage transmission lines. The investment firm says it also has the infrastructure and natural gas access needed to build at least 800 MW of gas-fired generation, either for the grid or customers like data center developers.
“Big Rooter is a landmark project that reflects the scale of investment being made in America’s energy future,” George Hershman, CEO of Solv Energy, said in a news release. The contractor is building the site’s solar array, substation, and transmission infrastructure.
Big Rooter’s pairing with active coal operations makes it unique within the nation’s small but growing coal-to-solar subsector, which has mainly focused on putting panels on former mine lands and retired industrial sites.
The largest of these projects is the 186-MW Tilden Solar Project in southern Illinois, followed by the 111-MW Martin County Solar Project in eastern Kentucky, which both went online last year atop abandoned coal mines.
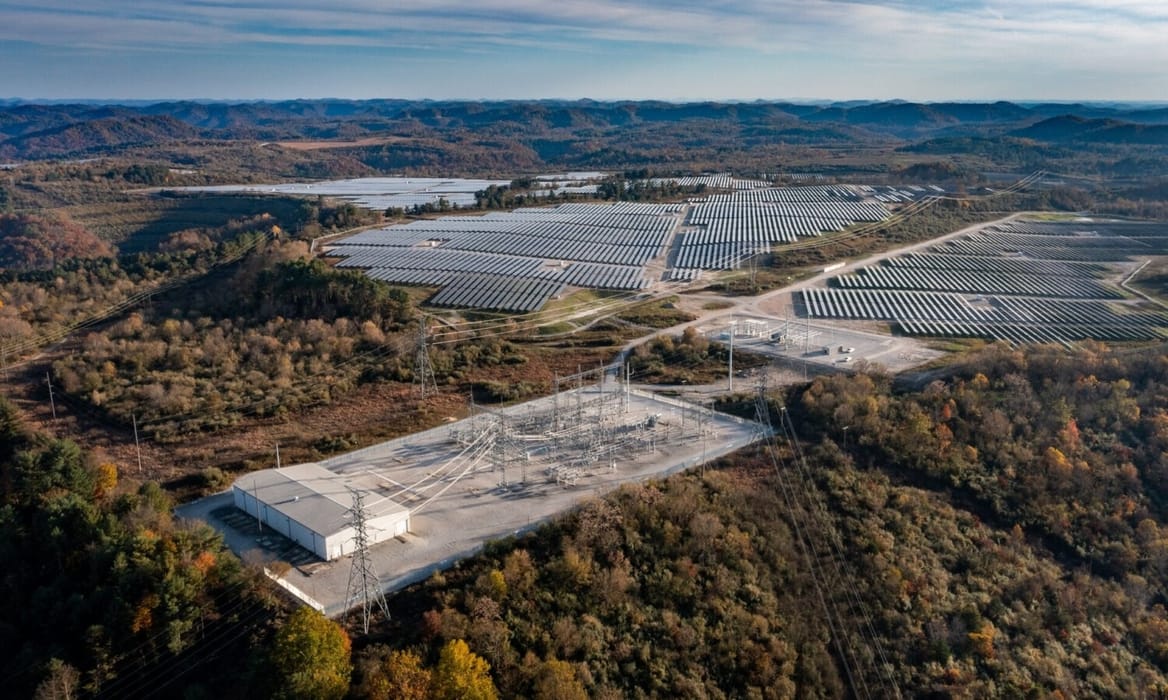
In Louisiana, the 240-MW Dolet Hills Solar Project is now being built on a former coal mine property. And the developer BrightNight is advancing the Starfire installation on remediated mine land in Kentucky.
In 2023, when BrightNight announced the Appalachian project, electric truck startup Rivian signed on as the anchor customer, with a 100-MW power purchase agreement. Starfire was initially envisioned as a roughly 800-MW project, but is now on track for 410 MW, with construction slated for late 2027 and planned operations in 2030.
“Earlier descriptions of a larger project reflected a broader long-term vision for the site, but as development has progressed, BrightNight has focused on the configuration that best aligns with current interconnection, permitting, site, and customer considerations,” a BrightNight spokesperson said by email. “We remain very enthusiastic about Starfire and its importance as a major redevelopment project on former coal mining land in Eastern Kentucky.”
Repurposing old mining sites for solar power has an obvious appeal. As opposition breaks out in rural areas over using prime farmland for solar — concerns stoked by Trump administration officials, including U.S. Agriculture Secretary Brooke Rollins — brownfield projects allow developers to sidestep those conversations and put sullied land to use. Doing so has typically proved more complicated and expensive than placing solar panels on flat or uncontaminated fields.
The 2021 bipartisan infrastructure law and 2022’s Inflation Reduction Act provided incentives to make it easier to finance clean energy installations on mine lands, while a $500 million Department of Energy program allocated funding for projects on current or former mines.
But last year, the Trump administration and Congress added more hurdles by phasing out tax credits for solar and wind energy, effectively ending the tax bonus for brownfield developments. And the administration scrapped at least one DOE mine-land award, for Mineral Basin Solar Power, as part of its sweeping cancellation of $7.6 billion in clean energy grants in the 16 states that voted for Democrat Kamala Harris in the 2024 presidential election.
“The federal policy landscape for developing clean energy on mines has changed, but the opportunity hasn’t,” said Jessica Wilkinson, the North America renewable energy team lead for The Nature Conservancy, a global nonprofit.
“In many parts of the country, wind and solar are the cheapest forms of energy and are succeeding on economics alone,” she added. “And if building on mine lands, brownfields, and landfills has fewer community conflicts, they may be seen as very enticing.”
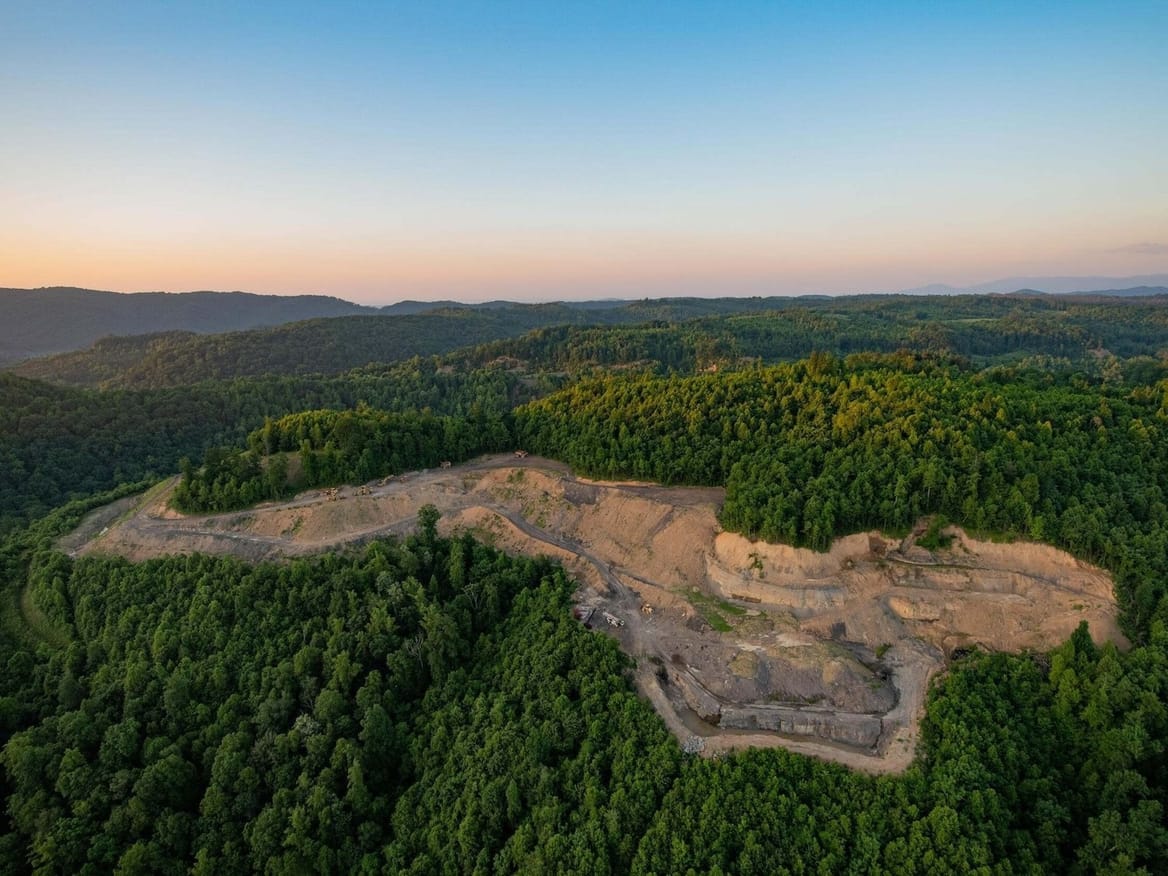
The nonprofit and its partners plan to develop 25 solar and battery storage projects on former mine lands that The Nature Conservancy manages in the Cumberland Forest, which spans parts of Kentucky, Tennessee, and Virginia. The first project, the 10-MW Wildcats Solar in Virginia, is expected to break ground this fall and could start delivering power to the grid next year.
Wilkinson noted that despite the federal pullback, states have continued to show support for what her group calls “mining the sun” projects. For example, Ohio and Colorado passed laws to incentivize renewable energy development on former industrial sites. And a handful of federal programs continue providing financial support for cleaning up coal mining areas — a crucial step for enabling future solar development.
“Communities still want to see these lands become economic engines again,” Wilkinson said.
Panamint, for its part, said it was able to secure clean energy incentives for Big Rooter Power before Trump signed the One Big Beautiful Bill Act on July 4, 2025, repealing large swaths of the Inflation Reduction Act.
“We ordered long-lead time equipment such as transformers and circuit breakers well before last summer’s OBBBA, so we were largely insulated from those impacts,” Totth said.
She noted that Panamint is partnering with U.S. firms First Solar and Nextpower (formerly Nextracker) to procure domestically made solar modules and racks. Big Rooter is also located in an “energy community” — the Department of Energy’s term for brownfield sites and areas affected by coal plant and mine closures. For those reasons, the company says it will receive a federal investment tax credit worth 50% of total project costs.
Yet as Panamint begins installing millions of solar panels in Texas, it has no plans to wind down production at the neighboring Twin Oaks coal plant.
“Twin Oaks is an economically competitive unit that provides low-cost reliability to Texas ratepayers, and we see no reason for an early retirement,” Totth said. She added that the company is also investigating both expanding the Calvert mine area and building a terminal facility to rail in coal for continued operations.
As Totth sees it, the new solar array will produce enough carbon-free power to “negate” the coal plant’s emissions profile on an annual basis.
It’s an example of the all-of-the-above approach to energy in Texas. Despite the massive amounts of solar, storage, and wind the state has built, it continues to cling to fossil fuels.
A federal appeals court finds the EPA acted improperly in terminating grants to boost clean energy projects. The Trump administration may appeal to the Supreme Court.
A federal appeals court has ruled that the Environmental Protection Agency acted improperly in terminating billions of dollars of “green bank” financing last year, setting up a potential showdown before the U.S. Supreme Court over one of the Trump administration’s earliest attacks on a key Biden-era climate program.
Tuesday’s divided ruling from the U.S. Court of Appeals for the D.C. Circuit is a victory for the nonprofit groups targeted by EPA Administrator Lee Zeldin as part of a broader attack on the Biden administration’s clean energy and climate spending.
In March 2025, the EPA moved to freeze $20 billion in funding under the Greenhouse Gas Reduction Fund (GGRF), which was created by the 2022 Inflation Reduction Act and is commonly known as the federal “green bank” program. The ambitious effort was meant to inject large-scale federal funding into climate and clean-energy lending pioneered by state-level green banks — lending institutions that have successfully enabled $21.8 billion in public-private investment to date.
The idea was to put federal money to work to boost financing for clean energy and climate-oriented projects in communities that have traditionally lacked access to it. That could spur a virtuous cycle that could yield between $150 billion to $250 billion in private-sector investment over the next 10 years, according to an April 2023 analysis by consultancy McKinsey.
That effort has been frozen in its tracks by the current EPA, forcing the nonprofits awarded grants to curtail operations. Those groups argued that the EPA’s actions violated the law by not spending money authorized by Congress.
“Despite efforts to harm the awardees with false allegations and misinformation, there remains no legal basis for terminating our grant award,” a spokesperson for Climate United, a consortium awarded $7 billion in GGRF funds, said in a Tuesday statement.
Before the EPA froze its funds, Climate United had committed hundreds of millions of dollars for solar projects for the University of Arkansas, financing to help small-scale trucking firms buy U.S.-built electric trucks in California, upgrades to shift buildings to clean energy and make them more efficient, and Native American–led clean energy projects. Only a fraction of those funds have been disbursed.
Because it hasn’t received its promised GGRF funding, Climate United — a partnership between investment firm Calvert Impact, multifamily affordable-housing financier Community Preservation Corp., and community-development financial institution Self-Help — has lost its CEO and had to reduce staffing. Meanwhile, plans have been scaled back at a network of state and county green banks and other community-development financing institutions that had counted on using federal funds.
In April 2025, a lawsuit brought by GGRF recipients won an early favorable ruling in federal district court, which the EPA appealed. A three-judge panel at the D.C. Circuit Court ruled 2–1 in the EPA’s favor in September, but the full appeals court decided to take up the case for review, leading to this week’s decision.
That doesn’t mean grant recipients can now get their money, however. The EPA has several days to file an appeal with the U.S. Supreme Court. The EPA did not immediately respond to emails and phone calls seeking comment on Tuesday. But Zeldin has vowed to fight to claw back the $20 billion in GGRF grants.
Another $7 billion in GGRF funds for the federal Solar for All program have also been terminated by the EPA, and legal challenges to that action are underway. The EPA has faced other recent legal defeats as it tries to terminate Biden-era climate funding.
GGRF recipients have continued to undertake smaller-scale financing deals and remain ready to resume projects if their full funding is restored, the Climate United spokesperson told Canary Media. “This program was designed to lower energy costs, create good jobs, and improve public health. We will continue to pursue every legal avenue available to us to unfreeze funds on behalf of the communities we serve.”
The state’s solar equity program has been in place for nearly a decade, but it wasn’t until recently, after years of grassroots efforts, that participation surged.
Any time, day or night, parents experiencing homelessness, domestic violence, or other emergencies can drop their young kids off at the Crisis Nursery in Urbana, Illinois, and know they’ll be safe and cared for.
Funding is a constant challenge for the 45-year-old nonprofit organization. But it was able to create a bit of financial breathing room by putting solar panels on its roof back in 2020, leading to significant savings on its energy bills.
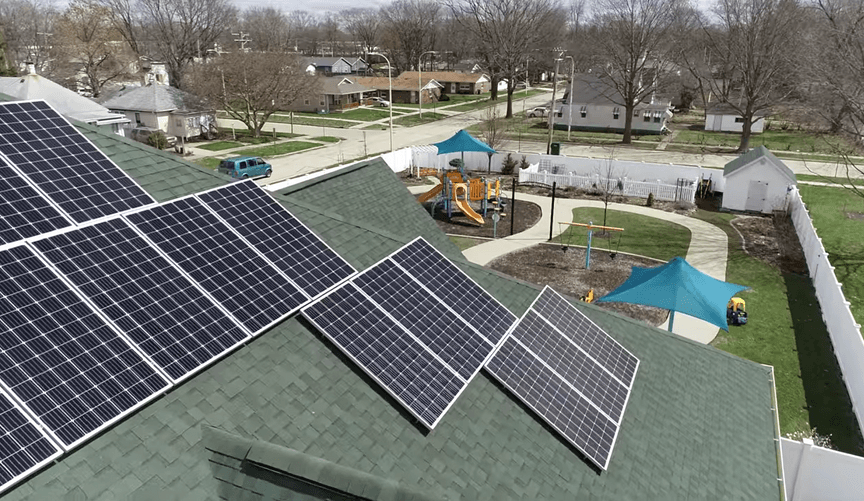
Crisis Nursery was one of the first beneficiaries of Illinois Solar for All, a state program to make the clean energy source accessible to households, nonprofits, and public facilities in lower-income communities and areas facing environmental injustice. Participants receive at least half the value of the energy generated by their solar array, with no up-front costs for buildings with four or fewer units, as well as no or low up-front costs for larger projects.
The program, created by a state law that took effect in 2017, was slow to get off the ground. The available funds went largely unspent for years, despite the savings on offer.
But in recent years, the program has become a success — and a lesson in the importance of long-term commitment and extensive grassroots engagement, as administrators and advocates see it.
During the initiative’s last cycle, from June 2024 to May 2025, more projects were approved than in its first five years combined, according to the Illinois Power Agency, the state entity that oversees the program. Last year, the Illinois Commerce Commission ordered a funding boost of $20 million, and every last dollar went out the door “almost immediately,” the Illinois Power Agency said in its latest annual report.
New application windows for Illinois Solar for All are open through September, for different types of projects, and program administrators expect heavy interest, including from those wait-listed in the last round.
State-level solar programs with an equity focus are especially important now, advocates say, given the Trump administration’s cancellation of the federal Solar for All initiative created by the Inflation Reduction Act. President Donald Trump and congressional Republicans also slashed tax credits for residential and large-scale solar projects with last year’s megabill.
Just as Illinois Solar for All is coming into its own, the loss of federal incentives raises new challenges. Without those dollars, the state funding simply won’t go as far as it once did.
“It’s a big swing,” said Wade Halva, who has long advocated for clean energy in southern Illinois, as a pastor and associate director of programs for Faith in Place, an environmental justice organization. “Does it mean the state program has to change? Can we even do residential at a guaranteed savings rate without federal incentives?”
But Jennifer Schmidt, Illinois Solar for All senior program manager for the Illinois Power Agency, sees a silver lining. “A sense of urgency driven by the sunsetting of federal tax credits,” she said, has helped fuel the recent success of Illinois Solar for All — and she expects the momentum to continue.
At the beginning, Illinois Solar for All had an awareness problem.
Many Illinois residents — particularly those in rural areas where solar adoption was low — had never considered putting panels on their roofs. Others may have liked the idea but felt they didn’t have the bandwidth to manage a complex home upgrade like solar, even if it was low- or no-cost.
And plenty of residents were just plain skeptical of a government program that sounded too good to be true.
“The first hurdle was getting the idea that the program existed out there — that it was real and it wasn’t a scam,” Halva said. “We were targeting people on the residential side who had written off getting solar because there was no way it was affordable.”
Once households decided to move forward, some faced new challenges. One common example: Many applicants had old roofs that needed to be updated before panels could be attached. Last fiscal year alone, Illinois Solar for All funded 88 roof replacements.
Things were a bit different for nonprofits and public facilities. Even if those organizations wanted to take advantage of Solar for All in the early years, the economics weren’t always on their side, because, as tax-exempt organizations, they could not access the federal tax credits for solar. The 2022 Inflation Reduction Act changed that — but it didn’t change the fact that these organizations were not very familiar with solar energy.
“So they hadn’t looked into it,” Halva said. “We ended up doing a lot of baseline solar education because we were reaching out to parties who had no market for it before.”
Crisis Nursery’s participation in the program is an example of this kind of outreach. Illinois Solar for All administrators contacted the nursery staff, encouraging them to participate and arranging a lease agreement with a solar developer in which the nonprofit paid nothing up front.
“We have a 10,000-square-foot building, so every little bit helps, especially during seasons when we are running our utilities” around the clock, said the nursery’s executive director Stephanie Record. “A lot of businesses may be able to alter their temperatures when people aren’t there to conserve energy. We have to be at that constant level of heating and cooling 24/7.”
Nearly 400 Illinois Solar for All projects went online last fiscal year, representing over 700 different building units.
There are now projects in almost every county in the state, unlike in 2023, when they were concentrated in the Chicago area, along with a band across the center of the state. Changes made in the past program year allowed projects for nonprofits and public facilities in census tracts adjacent to income-eligible and environmental justice counties to qualify. The areas designated as environmental justice communities also increased.
“These sorts of things matter a lot in who we can approach,” Halva said.
Illinois Solar for All projects can be developed only by solar companies that have been vetted and approved by the state.
In the program’s early days, few companies went through this process. Solar workforce training and entrepreneurship programs were created and funded by the state’s 2017 clean energy law, but it took a while for administrators to successfully create a system to match developers with trainees.
The workforce is much more robust today. Thirteen companies developed the Illinois Solar for All projects energized or developed last year, and a state website helps dozens of such approved vendors connect with clients.
Another key to the program’s success is its “grassroots educators” — community leaders paid by the state to raise awareness. Last fiscal year, almost $700,000 was awarded to 10 community organizations to hire grassroots educators for one-year stints. Nine of those groups have new funding for the work this year.
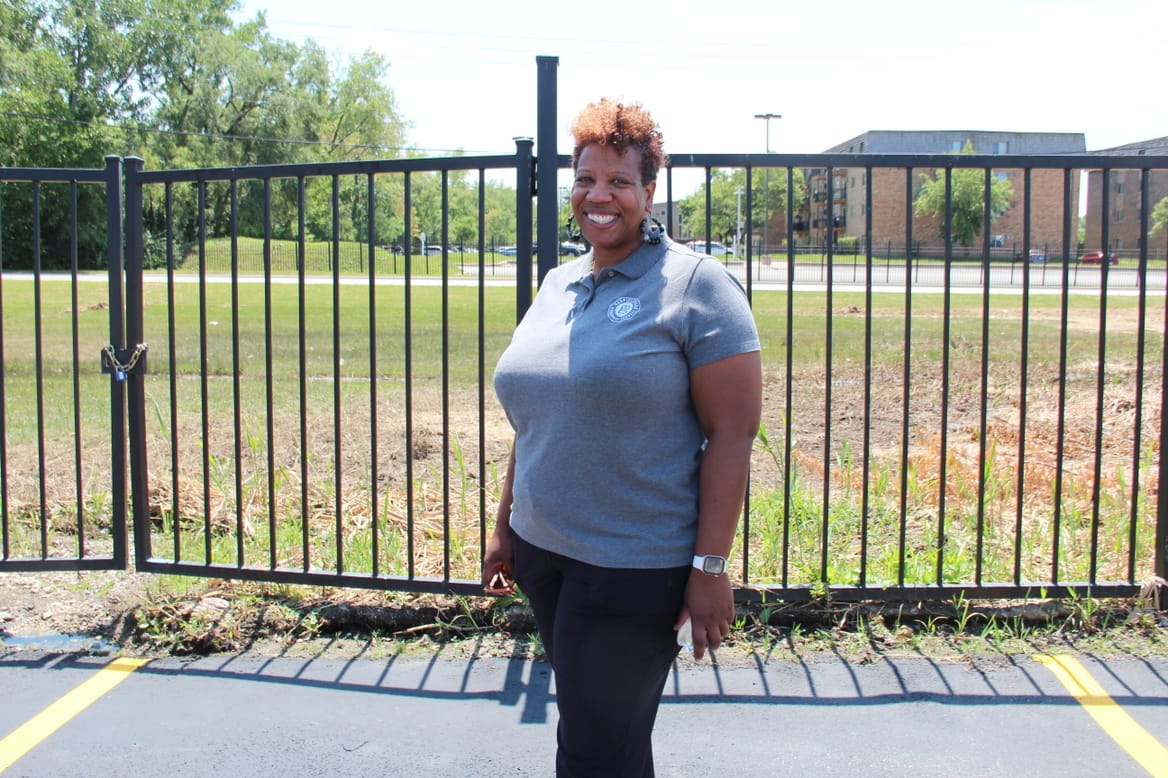
Three years ago, Aretha Berdell became a grassroots educator in the Garfield Park neighborhood on Chicago’s South Side, after she got rooftop solar through a separate state program called Illinois Shines. She often recruits people at events run by the Garfield Park Community Council, where she works as a sustainable housing associate, or by other local groups. It typically takes six or seven conversations before residents feel comfortable moving forward with solar, she said.
“I always tell my story — I haven’t paid [local utility] ComEd since last year,” she said. “We’re getting the word out. Especially if they’re seniors and don’t have access to the computer, I’m just helping them out, moving them along.”
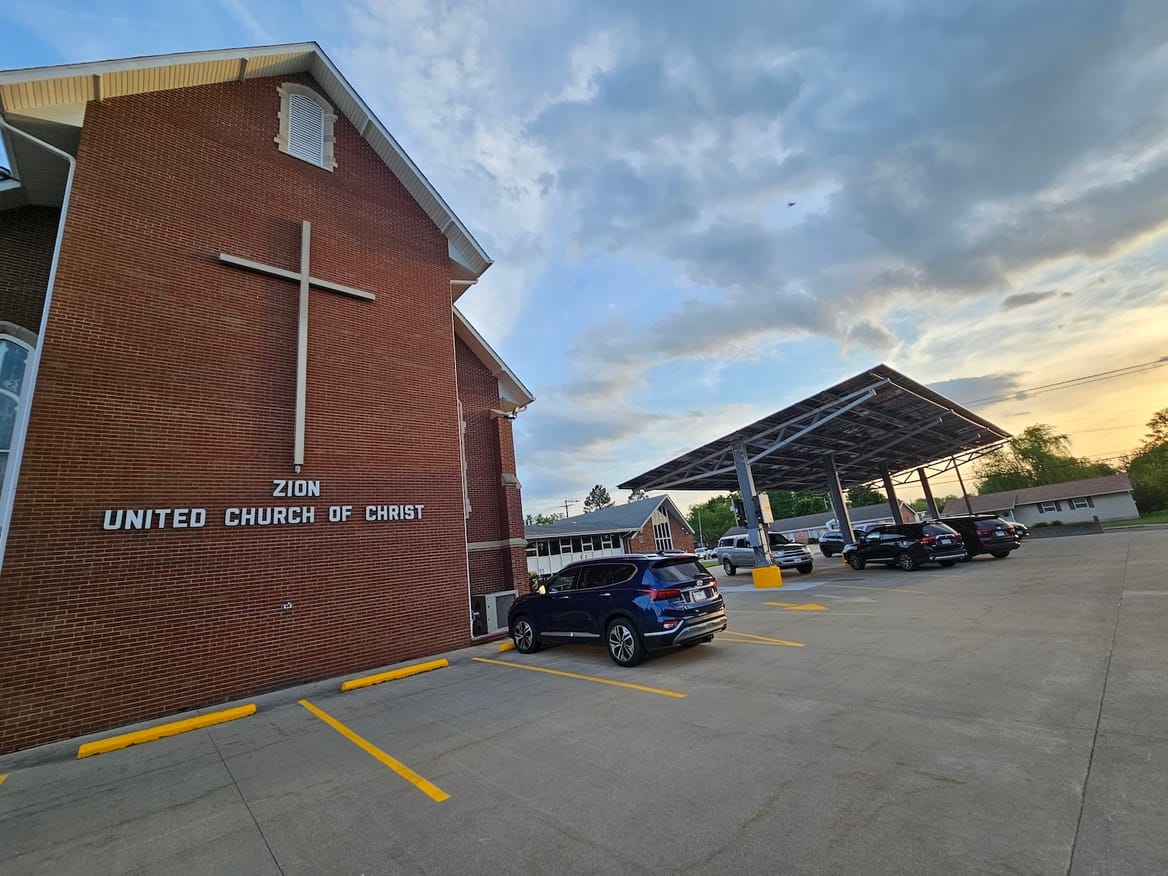
In and around the small southern Illinois city of Marion, the program — and Halva’s work as a grassroots educator — have led to solar arrays on a church, a local fire station, a senior center, a youth center, and a city-owned recreation facility called The Hub. The solar array on Zion United Church of Christ’s carport has saved thousands of dollars, which the church spends on its food pantry, providing hundreds of meals every Sunday and hundreds of bags of food each week.
Ellie Simpson, another grassroots educator, focuses on outreach to houses of worship, on behalf of Eco DioChicago, the Episcopal Diocese of Chicago’s organization for environmental justice and “creation care committee” — responsible for acting as stewards of the Earth. She said multiple church representatives contact her each month, “interested in starting the conversation about what it means to care for creation,” and using solar to reduce their carbon footprint and redirect funds from energy bills to pastoral work.
The personalized guidance that a grassroots educator can offer is crucial in working with faith-based groups, Simpson noted, since they range from organizations with large endowments able to make big investments to small entities with board members cautious of approving any expenditures.
“Some move quickly, some move slower,” she said. “Nonprofits and churches all have their own pace.”
Illinois Solar for All is entering into a new era this fiscal year. It will be the first time that federal incentives are unavailable — and administrators are still figuring out how to adjust, Schmidt said.
One bright spot is that many of the program’s arrays are developed as third-party ownership arrangements, in which solar developers own an array and provide the energy to the resident or organization — and those projects can still access federal tax incentives if they are operational by the end of 2027, or if they started construction before July 4 of this year.
In any case, state law calls for $50 million in funding each year for Illinois Solar for All. With that in mind, Schmidt said the program will be able to adjust to fill some gaps left by federal changes.
“We look at different potential funding pieces of a project, and if things change, we update,” Schmidt said. “Illinois Solar for All is not going anywhere.”


.svg)
